Something unexpected is happening across the American real estate landscape right now. The neighborhoods that once felt like guaranteed goldmines, the ones where bidding wars erupted on a Tuesday afternoon and homes sold for well above asking price within hours, are now sitting idle. Prices are softening. Inventory is climbing. Buyers are walking away.
Home values are falling for more than half of U.S. households. New research from Zillow shows that roughly 53% of all U.S. homes have lost value since last year, the highest share since 2012, at the tail end of home value declines after the Great Recession. That is a staggering shift. Let’s dive in and look at which once-celebrated neighborhoods are feeling the pain most right now.
1. East Austin, Texas: The Darling That Overreached
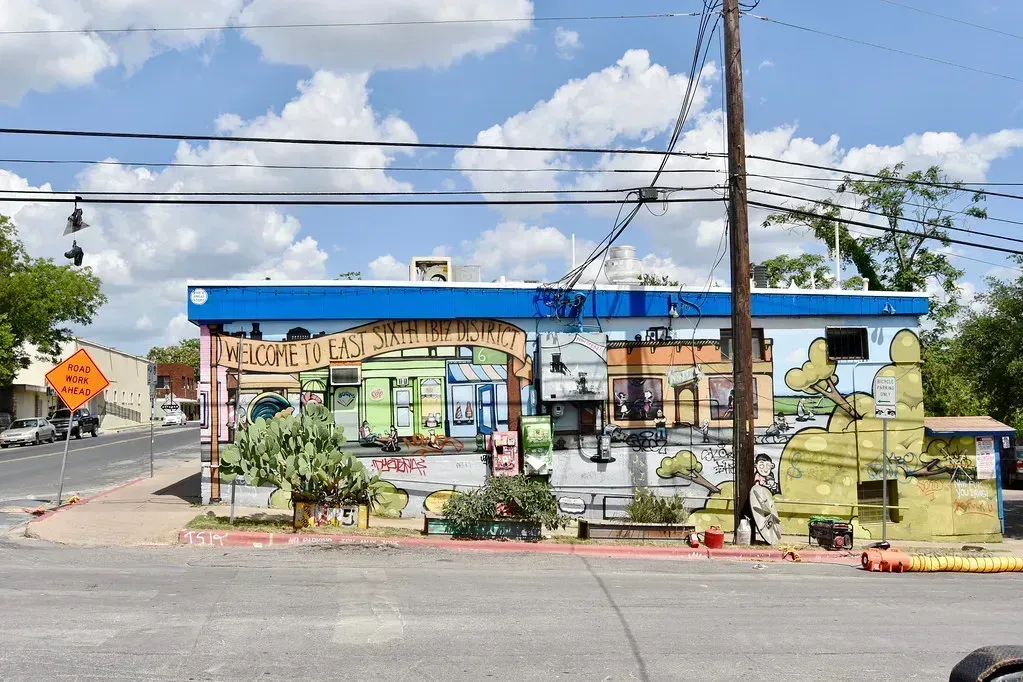
East Austin was the neighborhood everyone wanted to be in not so long ago. Coffee shops, live music, craft breweries, and rising home prices drew in young professionals and investors alike at a dizzying pace. It felt unstoppable. Then reality arrived.
According to Zillow data, Austin home values are down roughly 6.1% year over year. Austin is the poster child for this dynamic: its boom was extreme, its pipeline was heavy, and its repricing has been unusually sharp, with Zillow’s metro data showing meaningful declines into late 2025. Honestly, when a market rises that sharply, that fast, a correction is almost inevitable.
As of January 2025, the median sales price for the Austin area was $409,765, reflecting a decrease of 4.7% compared to January 2024. New supply arrived with a lag: permitting decisions made in 2021 and 2022 translated into completions and competition in 2024 and 2025. When listings rise, sellers lose leverage, and price cuts spread, especially in markets where buyers have lots of near-substitutes like new subdivisions and investor inventory.
2. SoMa and Mission Bay, San Francisco: Tech Bust Hits Hard

South of Market and Mission Bay in San Francisco were the epicenters of the tech boom. Glass towers, startup offices, and luxury condos. For a while, you almost felt like you were in the future just by walking down those streets. That energy has dissipated significantly.
The market for condos in SoMa, Mission Bay, South Beach, and the Civic Center area was particularly weak. Reports from Redfin and Compass both showed that condo price declines outpaced single-family homes across the city. Elevated HOA fees, concerns about downtown activity, and remote work preferences pushed more buyers toward neighborhoods with larger homes and more space.
Hiring in the Bay Area tech sector cooled significantly during 2023 and early 2024. Companies such as Google, Meta, Amazon, and Salesforce put in place hiring freezes and layoffs. With fewer new workers relocating and more uncertainty around compensation, demand for higher-end units cooled. The largest drops occurred in neighborhoods that rely heavily on condo sales, especially Mission Bay, SoMa, South Beach, Lower Nob Hill, and the Van Ness corridor, with many of these areas experiencing year-over-year price declines in the ten to fifteen percent range, according to Zillow and Compass data.
3. Pacific Heights, San Francisco: Even the Prestigious Aren’t Safe
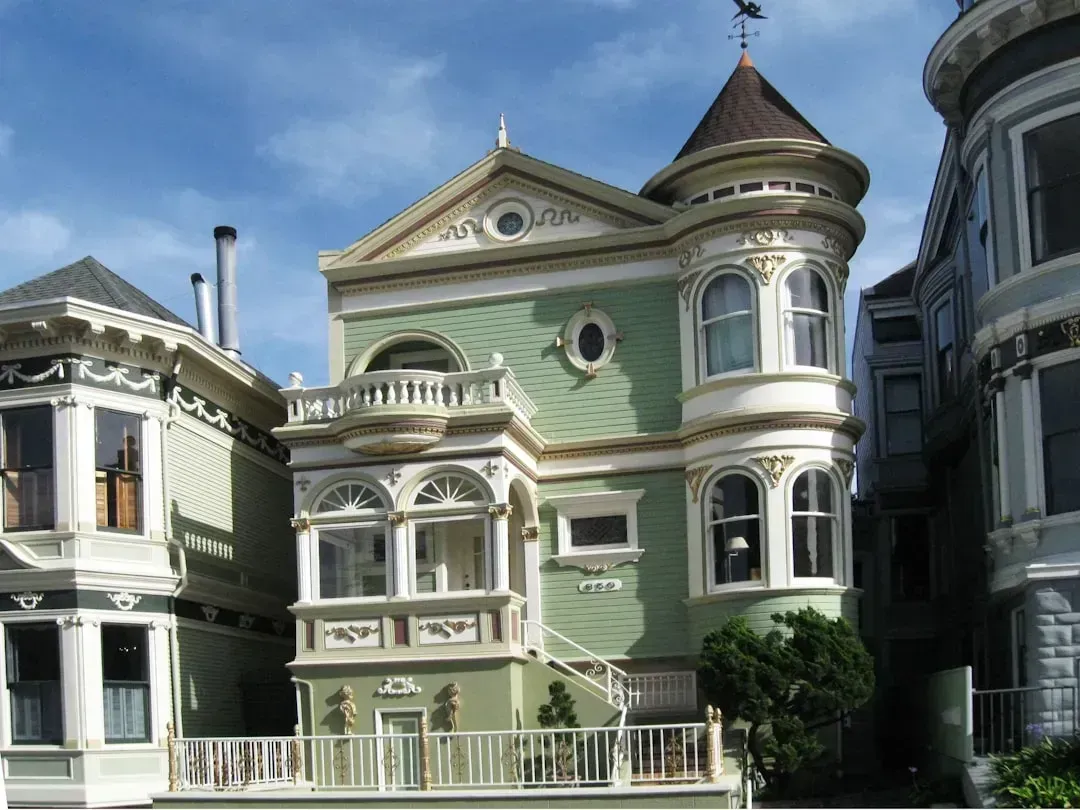
Pacific Heights was always considered one of San Francisco’s crown jewels. Grand Victorian homes, bay views, wealthy residents, and a prestige that seemed ironclad. It turns out no neighborhood, however prestigious, is fully immune to market forces.
While still pricey, Pacific Heights has seen home prices drop a significant 40.6% year over year as of early 2025, and properties typically sell for 1% below their asking price. Think about that for a moment. A neighborhood that once commanded top dollar is now seeing sellers accept less than asking price.
San Francisco’s property values grew less than 2% in the last fiscal year. The city’s assessment roll increased just 1.8%, and the sluggish growth can likely be attributed to the falling values of office buildings, hotels, and some multifamily housing, as well as property owners seeking to lower their tax bills. It’s hard to say for sure how deep this correction goes, but the data isn’t encouraging in the short term.
4. Cape Coral, Florida: The Hurricane Aftermath That Won’t Quit
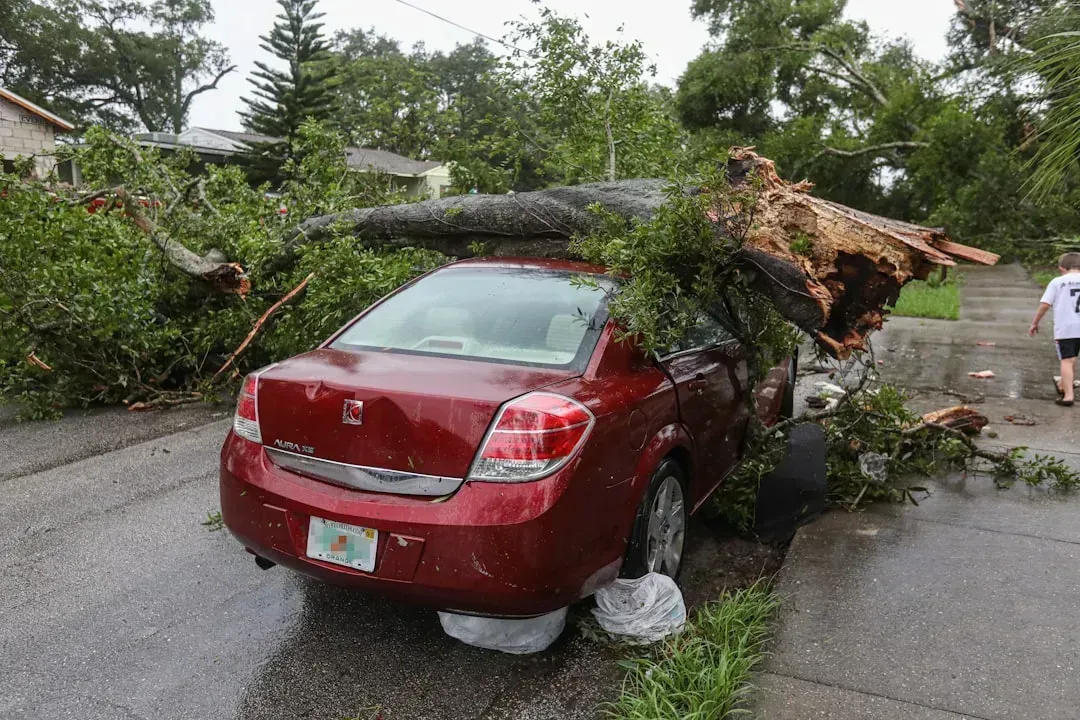
Cape Coral was one of those Sun Belt cities that became a magnet for pandemic-era migrants looking for warmth, affordability, and waterfront living. The canal-laced city seemed to have everything going for it. Then came the storms and the sobering market math.
Home values in Cape Coral soared by more than 60% from 2020 to 2022, creating an unsustainable price level that’s now correcting. According to Zillow, the median home value for the Cape Coral area declined by 10% over the past year as of October 2025. That is not a minor blip. That is a serious correction by any standard.
The area’s home prices have declined for 12 out of the past 13 months, and roughly half of the homes have experienced price cuts, according to Parcl Labs, a real-estate data-analytics company. Cape Coral also has the most homeowners underwater in the country, with nearly 8% owing more on their mortgages than their homes are worth. That is a sobering statistic that puts the scale of the problem into sharp relief.
5. Phoenix Metro Neighborhoods: A Desert Mirage

Phoenix felt unstoppable during the pandemic years. People poured in from California, fleeing high costs and remote-work-friendly attitudes about location. Whole neighborhoods transformed almost overnight. Then the tide turned.
Most major metros in the West and South saw at least half of homes lose value, led by Denver at 91%, Austin at 89%, Sacramento at 88%, Phoenix at 87%, and Dallas at 87%, according to Zillow. Phoenix sitting at 87% of homes losing value is a jarring figure, especially given how recently the city was seen as one of the hottest markets in the country.
Phoenix led the nation in terms of the share of houses on the market with falling prices. In April 2025, about 31% of some 20,000 active listings in that city had lowered asking prices before the homes were sold. A meaningful share of Sun Belt demand in 2021 and 2022 was investor-driven, covering single-family rentals, short-term rentals, and second homes. When yields compressed and financing costs rose, investors stopped being price-insensitive bidders and sometimes became net sellers.
6. Downtown Denver Neighborhoods: A Steep Rocky Mountain Correction
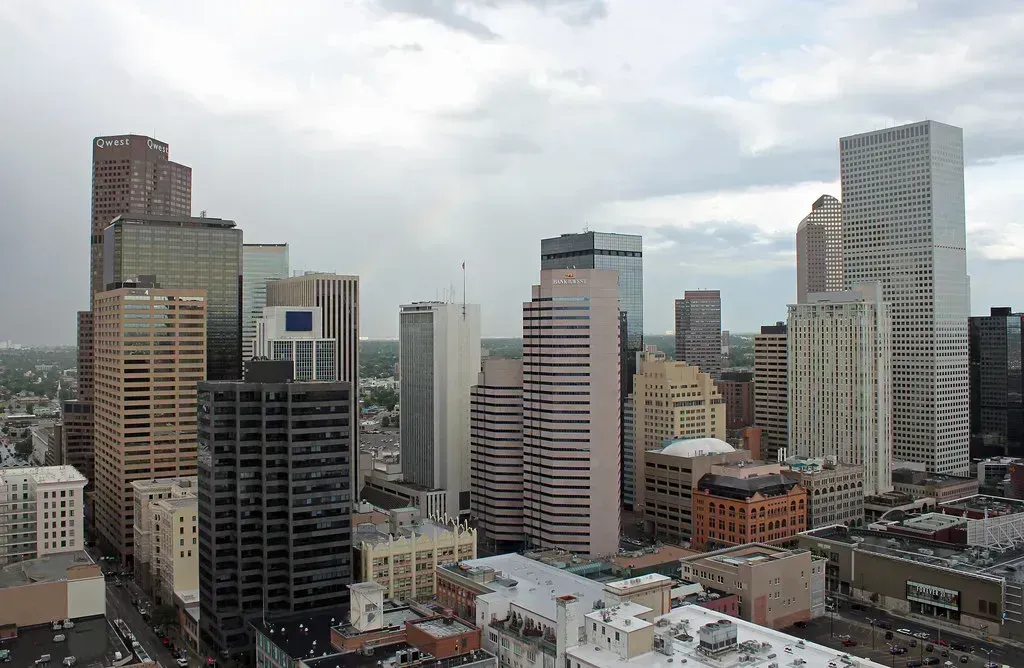
Denver’s downtown and surrounding neighborhoods were once the epitome of cool urban living in the Mountain West. Young professionals loved the proximity to skiing, outdoor life, and a booming restaurant scene. Property values reflected that enthusiasm enthusiastically, perhaps too enthusiastically.
Of all major metro areas analyzed, Denver homes got hit hardest. Ninety-one percent of properties in the city have lost property value over the past year. Let’s be real, losing value in nine out of ten homes is not a gentle correction. That is a market undergoing a serious reckoning.
Property values are linked to the real estate market, which has been slowed by high interest rates since the Federal Reserve raised them to curb inflation in a post-pandemic world. Property values in most Denver neighborhoods held steady or even dropped from 2022 to 2024, according to data released by Denver’s Assessor’s Office. The correction is broad and deep, and supply finally catching up to demand is a big part of the story here.
7. Tampa’s Waterfront Neighborhoods: Flood Risks and Financial Pressure

Tampa’s waterfront neighborhoods were darlings of the real estate world not long ago. Warm weather, relatively affordable prices compared to Miami, and a growing local economy made this area a magnet. The story has grown more complicated since then.
Tampa ranks among the steepest decline markets in the country, reflecting a retreat in demand and a rising supply of homes. Cape Coral faces a projected decline of 10.2%, followed by North Port at 8.9%, and Tampa at 3.6%, according to Norada Real Estate forecasts for 2026.
In Florida metros in particular, nonmortgage carrying costs including insurance and taxes can change the affordability equation even if the sticker price looks down only a few percent. Think of it this way: if your insurance bill doubles, a modest price reduction means almost nothing to your monthly budget. Nearly every market in Florida saw most homes depreciate since 2024.
8. Dallas-Fort Worth Suburban Belts: Oversupply Arrives

The Dallas-Fort Worth area was the destination for corporate relocations and remote workers throughout the 2020 pandemic. Companies moved their headquarters there. Subdivisions popped up almost weekly on the outer rings of the metro. It seemed like demand was bottomless. It wasn’t.
Homeowners in Dallas are among the more likely to list below what they previously paid, reflecting the shift in demand since the early stages of the 2020 pandemic. According to forecasts from Realtor.com, Austin could see the steepest decline in the Lone Star State, but three other Texas cities are also seeing falling home prices, including San Antonio, Dallas, and Houston.
The housing market softening follows a pattern seen across multiple Texas urban centers, where inventory levels have climbed above pre-pandemic levels. This increased supply, combined with higher mortgage rates, has shifted negotiating power toward buyers in a market that previously strongly favored sellers. The pendulum, in other words, has swung decisively the other way.
9. Sacramento Suburban Corridors: Remote Work Boom Goes Bust
Sacramento had a moment during the 2020 pandemic. As San Francisco residents sought more space and lower prices, Sacramento was the natural landing pad. Prices shot up fast. Entire suburban corridors transformed in a matter of months. That wave has receded now.
In Sacramento, roughly 88% of homes have lost value, tying Phoenix and Dallas as among the hardest-hit major metros in the country, according to Zillow data. That is nearly nine out of ten homes going the wrong direction. For homeowners who bought at the peak, that is an uncomfortable reality to sit with.
The decline in home values is especially pronounced in many Sun Belt and West Coast metro areas where rapid growth during the 2020 pandemic is now unwinding. Sacramento ticks both boxes. After multiple years of double-digit home price appreciation during the 2020 pandemic, prospects for future price growth are anchored by low affordability conditions sidelining borrowers, especially first-time homebuyers. The buyers who once flooded in from the Bay Area are a far smaller cohort today.
10. Orlando-Area Neighborhoods: Tourism Town Loses Its Shine
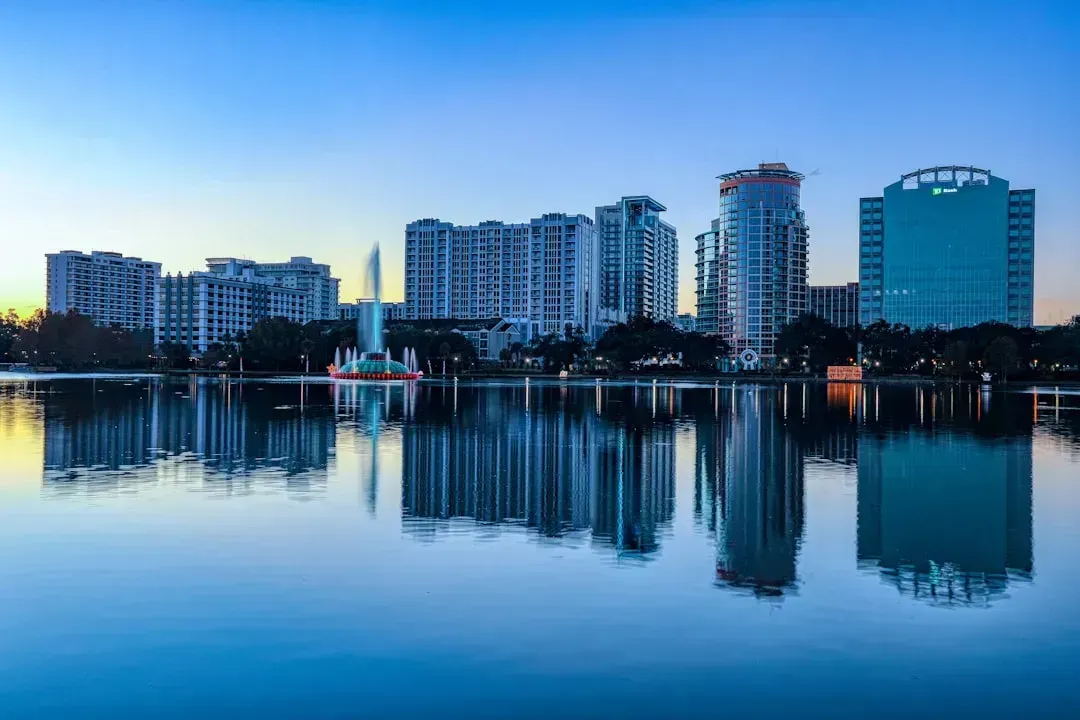
Orlando was another pandemic-era darling. Affordable housing by coastal standards, sunshine, a strong tourism economy, and plenty of new construction made it attractive to buyers from across the country. The momentum has stalled in a meaningful way.
Orlando, Florida, is listed among other notable markets with notable year-over-year home value declines alongside Dallas, Phoenix, and Jacksonville, according to Zillow analysis reported by ConsumerAffairs. The increase in inventory has also changed the dynamics of buying a home, especially in the Sun Belt, where prices have actually fallen in several major cities as new homes are built and fewer people flood into the region compared to the early pandemic years.
Soaring insurance premiums in these areas, or the outright refusal of companies to provide coverage, are making homes less appealing, resulting in decreased demand and falling property values. That is the underappreciated part of the Florida story. It’s not just about mortgage rates or oversupply. The insurance crisis is a whole separate force dragging values lower in ways that are difficult to reverse quickly.
11. St. Louis Inner Neighborhoods: Fiscal Challenges and Stagnation

St. Louis is a different kind of story compared to the Sun Belt boomtowns. This is not a market that soared to stratospheric heights. It’s a market that struggled for years and is now feeling even more pressure from rising local taxes, population outflow, and economic headwinds.
High property taxes, crime rates, and lack of population growth are cited as primary factors behind Chicago-style fiscal challenges affecting the St. Louis housing market, with the average cost of a home sitting around the lower end of major city averages. St. Louis home prices dropped 2.2% since the prior year, with the city’s median home price at around $221,000. An affordability crisis stemming from rising taxes in some municipalities has been a persistent drag on prices.
St. Louis ranked second on Realtor.com’s list of projected price-decline markets, with an expected fall of 11.7%, trailing only Austin, Texas, according to forecasts cited by Newsweek. Meanwhile, the median time between purchasing and selling a home nationally hit 11 years from July 2024 to June 2025, an all-time high, suggesting that even in declining markets, homeowners are choosing to wait rather than sell at a loss. In St. Louis, that kind of paralysis can become self-reinforcing, trapping neighborhoods in a slow, grinding decline.
The big picture here is not doom and gloom for every homeowner in America. While household budgets cannot always accommodate elevated housing costs, Zillow senior researcher Treh Manhertz has described what we’re seeing as “a normalization, not a crash,” noting that the vast majority of homeowners still have significant equity built up over years of ownership. Still, if you own a home in one of these once-celebrated neighborhoods, the data above deserves your attention. What would you do if you realized your neighborhood was quietly sliding off the map while others were still buying in?


Leave a Reply