
The headline numbers everyone’s talking about
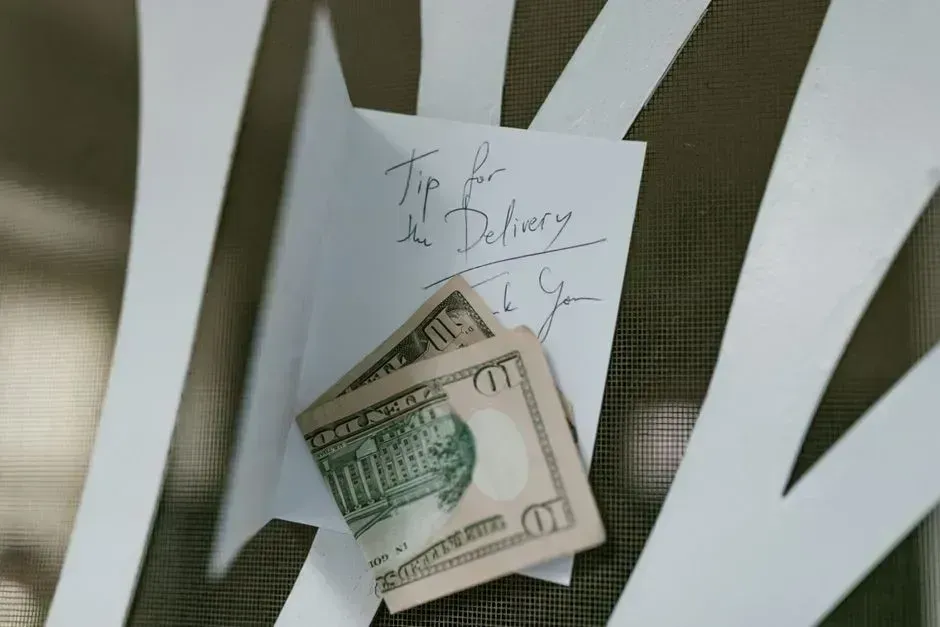
Survey after survey in 2025 and 2026 has landed on a similar theme: Americans are fed up. A WalletHub survey found that 83% of Americans want automatic service charges banned as tipping culture spirals out of control, with nearly 9 in 10 saying tipping has gotten out of control. That’s not a fringe opinion anymore, it’s close to consensus.
Bankrate’s numbers point in the same direction, though slightly less dramatically. Its research found that nearly 2 in 3 Americans have a negative view of tipping, but tipping activity appears to be stabilizing after recent years of decline. That last part matters. The frustration is real, but the actual behavior tells a more complicated story than the outrage headlines suggest.
Tip creep: why you’re being asked everywhere now
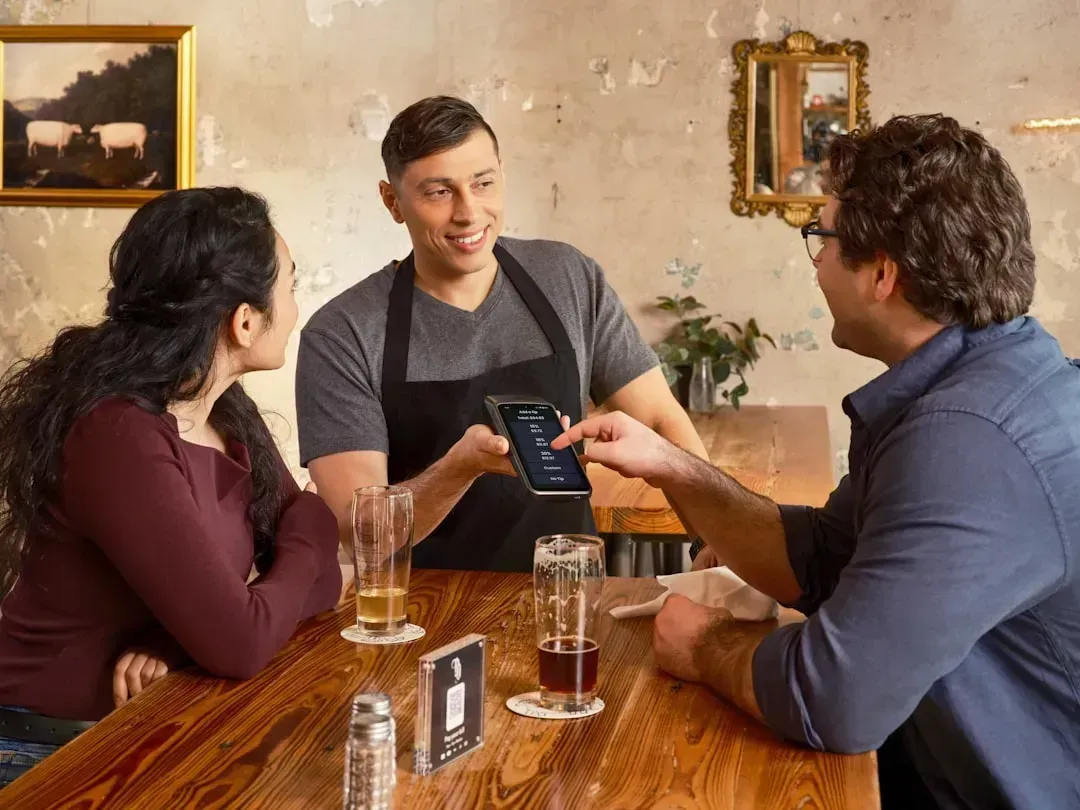
Part of what’s fueling the sense that things are worse is simply that tipping prompts have spread into places they never used to exist. Pew Research Center’s landmark survey of nearly 12,000 adults found that 72 percent of Americans feel that tipping is now expected in more places compared to five years ago and that 29 percent of respondents think of tipping as an obligation rather than a choice. Self-checkout kiosks, retail counters, and even hardware stores have started adding suggested gratuity screens.
This isn’t accidental. Payment processors have made it trivially easy for any business to bolt on a tip prompt, and once one competitor does it, others tend to follow so they don’t look stingy toward their own staff. The result is a landscape where the request to tip has multiplied even in categories where nobody expected it a decade ago, which naturally breeds resentment regardless of whether people are actually giving less money overall.
What payment processors actually show
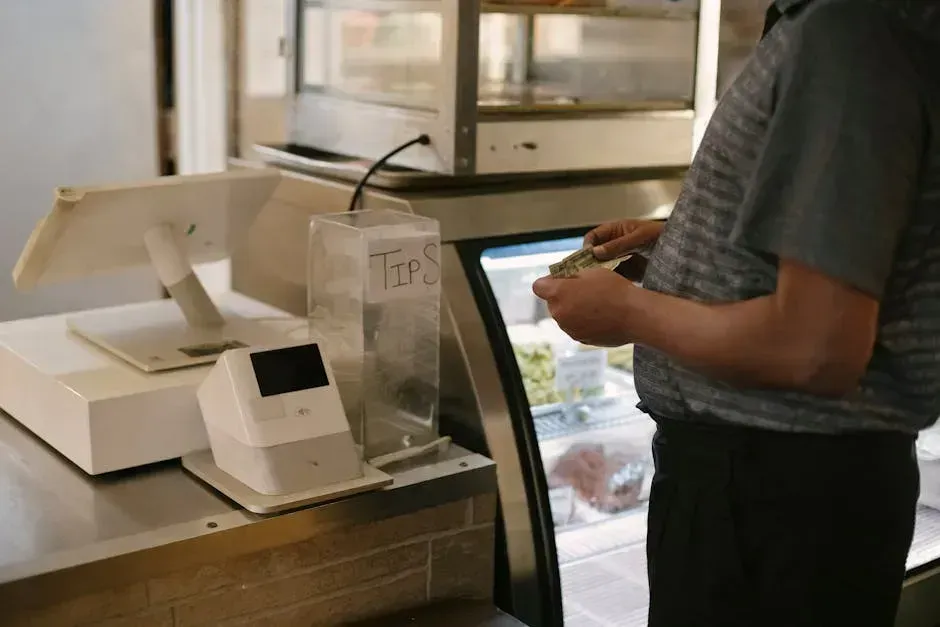
Surveys measure feelings, but payment data measures dollars, and the two don’t always agree. Square’s aggregate transaction data across full-service restaurants found that the median tip steady at 19.4% in Q4 2024, essentially flat against 19.6% in 2019. That’s a remarkably small shift for a category everyone assumes is collapsing.
Zoom out to food and beverage spending more broadly, though, and a softer trend appears. A separate Square analysis showed the overall average tip percentage for food and beverage orders falling to 14.9% in Q2 2025, down from 15.5% in 2023. The gap between these two numbers hints at something important: sit-down dining is holding up far better than quick-service and counter transactions, where tipping was always shakier ground to begin with.
The restaurant paradox nobody quite agrees on
This is where the data genuinely seems to contradict itself, and it’s worth sitting with that rather than picking a side. Bankrate’s June 2025 survey found that the share of Americans who say they “always” tip at sit-down restaurants fell from 77% in 2019 to 65% in 2024, the lowest figure since Bankrate began the survey in 2018. That looks like a clear decline.
Yet Square’s transaction records for the same period show tipping rates barely moving. The likely explanation is that fewer people are tipping automatically as a reflex, while those who do tip are still landing in roughly the same percentage range they always did. In other words, people are thinking about it more and defaulting less, which shows up in survey answers about habits before it shows up in the actual math on the receipt.
Where consumers really are cutting back

Not every category is holding steady, though. A Popmenu survey found that nearly 80 percent of consumers now describe modern tipping practices as ridiculous, and 44 percent say they are tipping less than last year. That same research broke down exactly where people are pulling back.
The list is telling: restaurants at 35 percent, grocery delivery at 24 percent, hotel staff including housekeeping and bellhops at 19 percent, taxi and ride services at 19 percent, auto repair at 19 percent, and hair salons and barbers at 18 percent. Coffee shops took a noticeable hit too, with the same wave of research finding that 39 percent of consumers tip at coffee shops, down from 46 percent in September 2025, while 41 percent tip restaurant servers 20 percent or higher, down from 45 percent.
The tip screen problem, in numbers
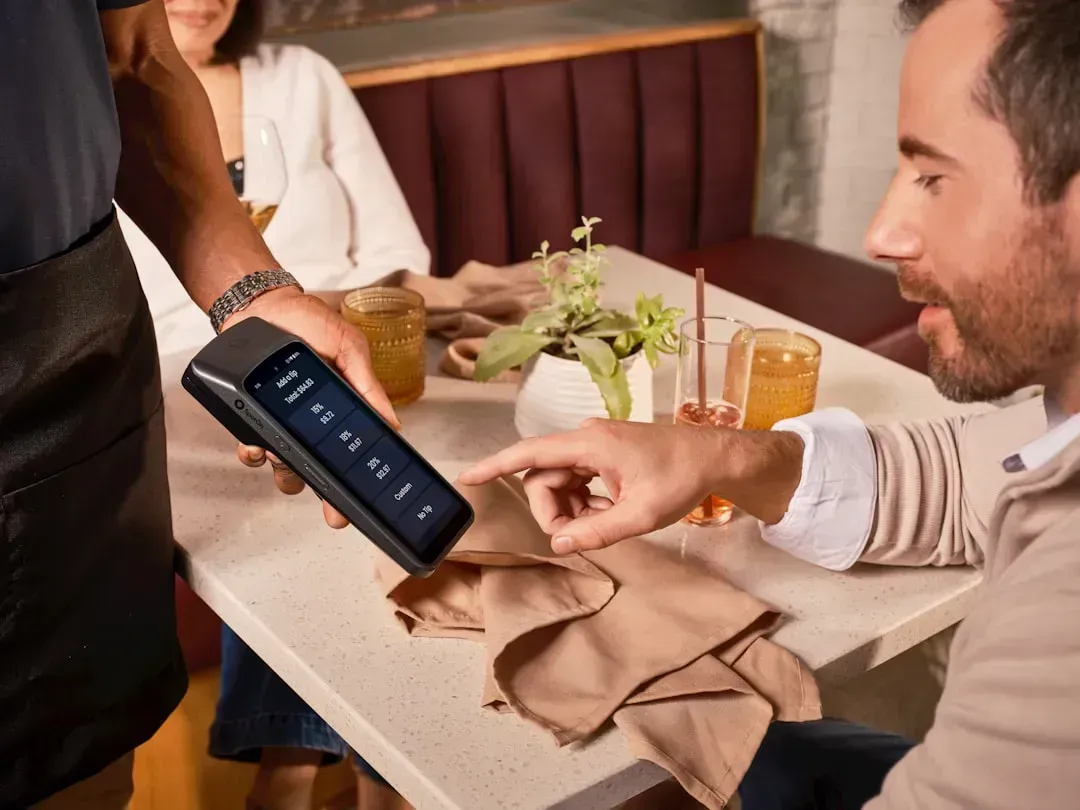
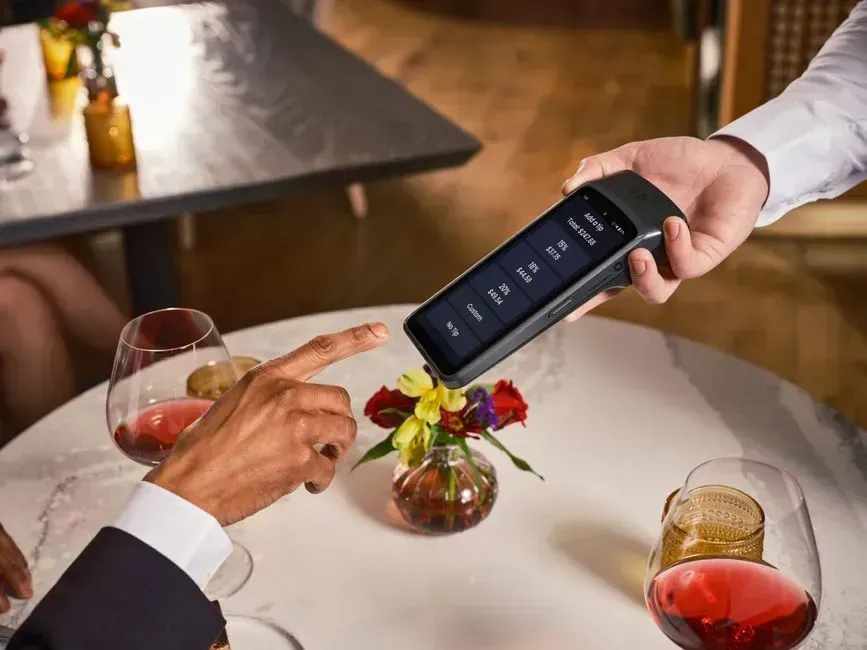
Digital tip prompts get blamed for a lot of this fatigue, and the survey data backs that up pretty directly. Pew found that 32% said the prompts are “annoying” and another 41% said they are “inappropriate” in at least some contexts. Meanwhile a broader look at consumer sentiment around these screens found that 40% oppose suggested tip amounts on screens and 72% oppose automatic service charges.
There’s also a shift happening in how people interact with those screens once they’re forced to use them. Popmenu’s research found that the survey found that 36 percent of diners now opt for a custom tip rather than selecting one of the suggested amounts. And when a screen does prompt for a tip, 59 percent of consumers say they feel compelled to leave one, down from 66 percent in September 2025. That’s a meaningful drop in just a few months, suggesting people are getting more comfortable ignoring the psychological nudge.
Confusion is doing as much damage as the money itself

A lot of the frustration isn’t really about the dollar amount at all. It’s about not knowing what’s expected anymore. Research on the topic found that in a Pew survey of nearly 12,000 people, only about 34% said they find it easy to know when and how much to tip nowadays.
That uncertainty shows up in how people set their baseline. Pew’s data found that 57% of respondents would tip 15% or less for an average meal at a sit-down restaurant, while only one-quarter of respondents say that they regularly tip 20% or more at full-service restaurants. When most people can’t agree on what a “normal” tip even looks like anymore, it’s no surprise the whole system feels chaotic even to people who tip generously most of the time.
Who’s actually driving the pushback
The backlash isn’t evenly distributed across generations or income brackets, though most public data on this focuses more on behavior than demographics. What is clear is that the financial squeeze is doing a lot of the heavy lifting behind these shifting habits. Bankrate’s own researchers pointed to the connection directly, noting that this is compounded by customers having less disposable income due to inflated costs for food, energy and other necessities.
That pressure shows up in related spending decisions too. Bankrate found that around 2 in 5 Americans (39 percent) expect to spend less on dining out this year. Fewer restaurant visits naturally mean fewer tipping opportunities altogether, which complicates any attempt to measure “tipping culture” purely through percentage-based surveys.
What workers on the other side of the counter are seeing
None of this is abstract for the people whose paychecks depend on it. Tips remain a genuinely significant part of hospitality income, with one analysis finding that tips comprised 23% of total restaurant wages in 2024. Even modest percentage shifts translate into real changes in take-home pay for millions of workers.
Geography plays a bigger role in this than most people realize, too. An analysis of Toast payment data found that Delaware leads the nation in restaurant tipping, while California ranks last, creating very different economic realities for workers in those states. A server’s experience with “tipping culture” in 2026 depends heavily on where they happen to be standing behind the counter.
The bigger picture: is it actually getting worse, or just louder
Putting all of this together, the honest answer is that tipping culture is not collapsing in the way social media complaints might suggest. Traditional, established tipping categories like full-service dining have stayed relatively stable in the raw payment data, even as public sentiment toward tipping has soured sharply. The resentment is real and well documented, but it’s aimed more at the sheer volume of tip requests than at some dramatic drop in generosity where tipping was already the norm.
Where things have genuinely shifted is at the edges: coffee counters, delivery apps, retail checkouts, and other newer or borderline tipping scenarios. That’s exactly where the newest wave of tip prompts has been aggressively rolled out, and it’s exactly where consumers appear to be pushing back hardest. The story isn’t one simple trend line going down. It’s a split between categories where tipping was always expected, which remain fairly steady, and categories where it was recently forced into the conversation, which are now seeing the clearest signs of retreat.
Final thoughts
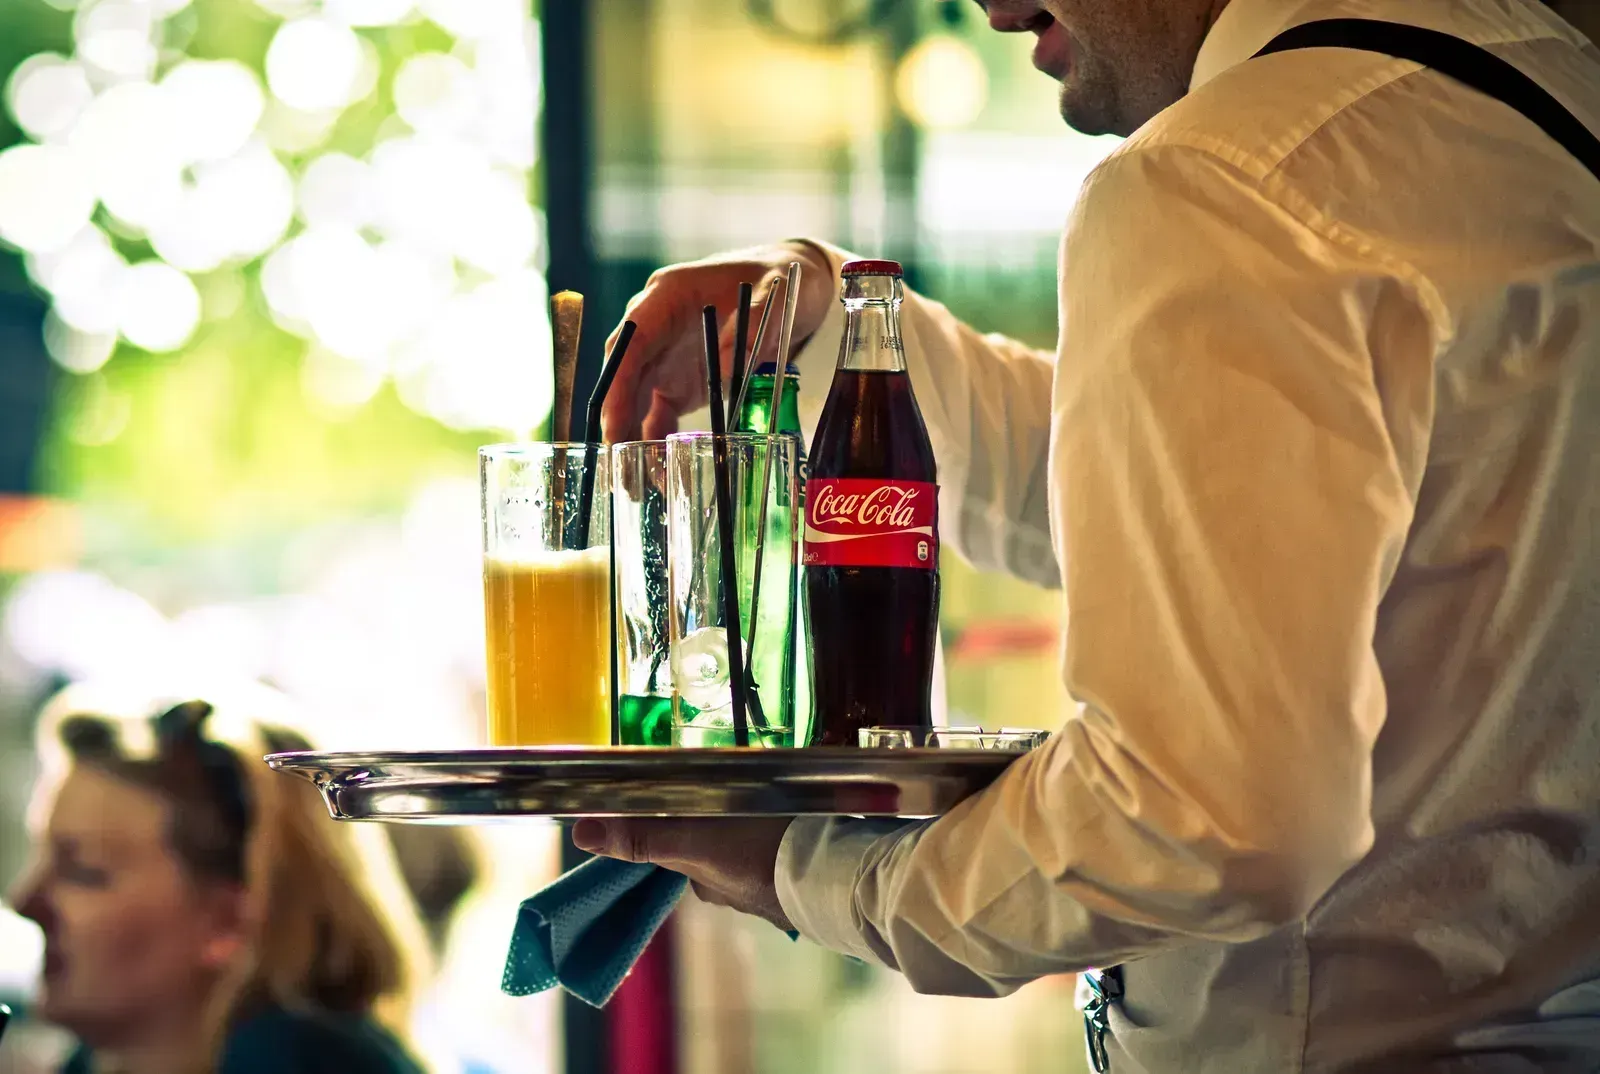
The data paints a more nuanced picture than the “tipping is dying” narrative that dominates social feeds. People are frustrated, confused about the rules, and increasingly willing to tap “custom” instead of hitting the suggested percentage on a screen. Yet in the places where tipping has always mattered most, like the sit-down dinner with a server who actually earns their income that way, the numbers have barely budged. What’s really changing is where the line gets drawn, not whether people still believe in tipping at all.


Leave a Reply