
Housing affordability is usually measured with a simple ratio: the price of a typical home divided by what a typical household earns in a year. It shows how many years of income a purchase would take, before any mortgage interest or fees.
The countries below rank among the hardest places to buy by that yardstick, based on 2026 datasets. The sources use different methods, so the numbers aren’t directly comparable from one entry to the next. Each section names its source.
Nigeria
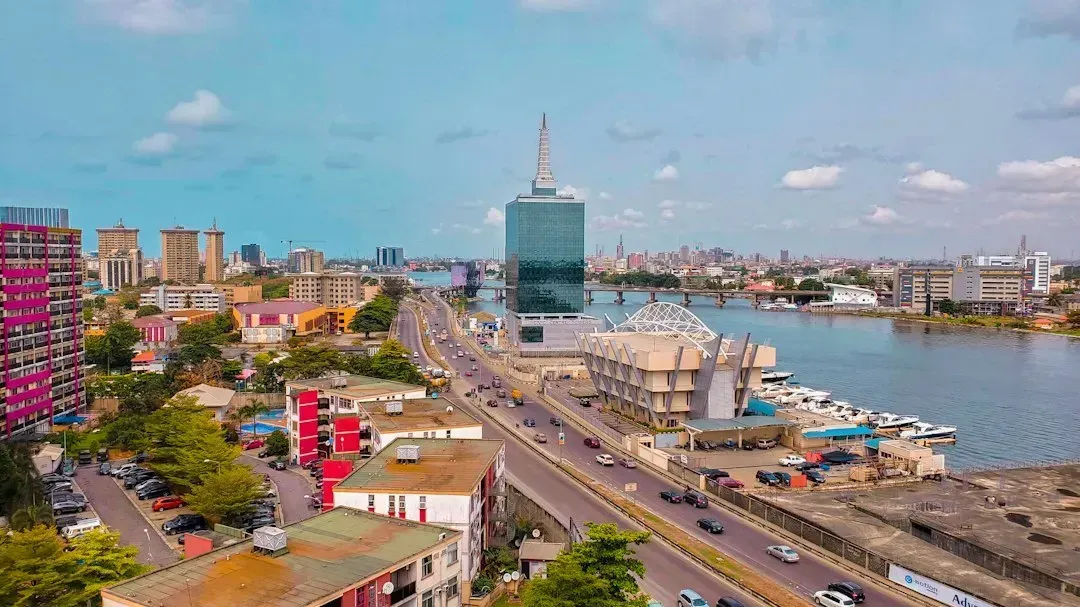
Nigeria sits at the top of Numbeo’s 2026 country table, with a price to income ratio of 93.7. Sri Lanka, Ghana, Cuba and Cameroon follow it. That makes Nigeria a clear outlier in this dataset.
Numbeo’s formula assumes a 90 square metre apartment and compares its estimated price with family disposable income, based on one and a half times the average net salary. The ranking relies on Numbeo data rather than official government figures, so it’s best read as a strong signal, not a precise measurement.
Syria

In a Visual Capitalist comparison, Syria records the world’s highest home price to income ratio, at 86.7. The ratio shows how many years of median household income would be needed to match the median home price. At that level, ownership isn’t a realistic goal for most households.
The figure comes from a dataset with a limited range of countries. Visual Capitalist also notes that the measure does not account for mortgage rates or other homeownership costs. Real conditions on the ground, especially in a country shaped by conflict, are likely more complicated than one ratio can show.
Sri Lanka

Sri Lanka comes second in the same Visual Capitalist ranking, with a ratio of 40.8. By that measure, a median home costs about forty years of median household income. Few people could save for that over a working life.
Numbeo’s 2026 table also places Sri Lanka near the top, right after Nigeria. Two separate datasets pointing the same way adds some weight to the finding, even though both rely on estimates.
China

China is third in the Visual Capitalist ranking, at 34.6. That is far above the level most lenders treat as manageable. For a typical household, buying outright without family help looks very difficult.
The benchmark gives some perspective. A ratio above 10 already signals a problematic market for buyers, according to a Dutch bank economist cited by Euronews. China’s figure is more than three times that mark.
The Philippines

One 2026 comparison of 20 countries found the Philippines had the worst ratio in its dataset, at 39.0 times income. The table lists a median income of roughly seven thousand dollars against a median home price of about $265,000. That gap explains the result.
Visual Capitalist also lists the Philippines among the world’s least affordable housing markets, alongside South Korea, Thailand and Vietnam. The two sources use different methods, yet they land in the same place.
Thailand

Thailand follows the Philippines in the 20 country comparison, at 35.6 times income. The table shows a median income of about eleven thousand dollars and a median home price near $395,000. Prices in that dataset are listing prices, which can run higher than final sale prices.
Thailand also appears in Visual Capitalist’s list of the world’s least affordable housing markets. Taken together, the two sources suggest the problem is not a quirk of one methodology.
Costa Rica

Costa Rica posts a ratio of 28.1 times income in the same 2026 comparison. The median income is listed at about fifteen thousand dollars, while the median home is around $419,000. That makes it more expensive to buy than many places with similar wages.
Part of the explanation may be that the dataset uses listing prices, which can be influenced by foreign buyers and resort areas. That is an inference, not something the source states. Local buyers on typical salaries would face a much steeper climb than the headline ratio implies.
Portugal

Portugal stands out in Europe. A home in Lisbon now costs about 18.7 times a typical household’s annual income, according to Numbeo’s latest figures. Among Europe’s major cities, only the Croatian coastal city of Split matches it.
That is almost double the level considered problematic. The figure refers to the capital, not the whole country, so prices in smaller towns may look different. Still, it shows how far prices have moved ahead of local wages.





Leave a Reply