
Chicago, Illinois: The nation’s new congestion capital
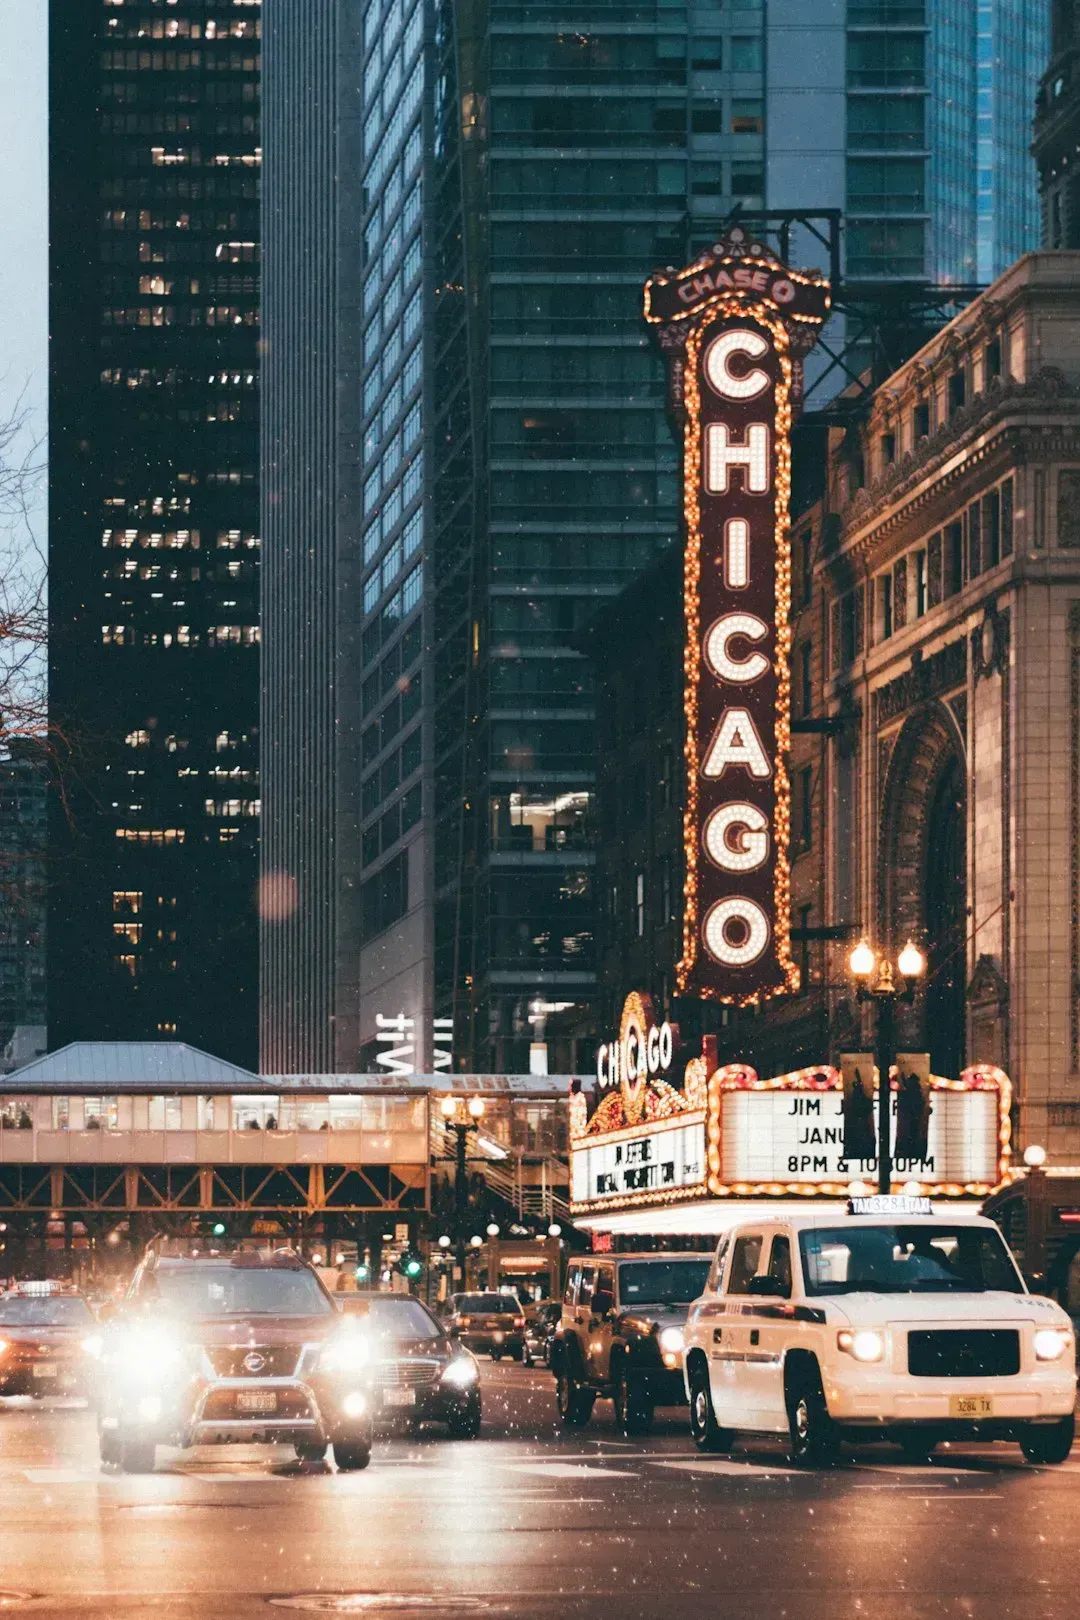
Chicago pulled off the unfortunate distinction of climbing to the very top of the pile in 2025. Rising from the No. 2 spot the year before, Chicago became the most congested city in the U.S., according to INRIX. Drivers there lost 112 hours to traffic, costing them $2,063 each. That’s not a small inconvenience. It works out to nearly three full work weeks spent sitting in a car going nowhere fast.
The numbers behind the daily grind are almost as telling as the headline figure. During the worst parts of the morning and evening commutes, peak speeds in Chicago dropped to just 21 mph, while off-peak driving averaged 42 mph, and speeds during the last painful mile of the morning commute downtown fell to a snail’s pace of 9 mph. Analysts point to Chicago’s role as a transportation crossroads as part of the problem. INRIX says the reason for the traffic increase makes sense when you understand that Chicago’s one of the nation’s largest economic centers as well as a major transportation crossroads for rail, trucking and air travel.
New York City, New York: Slow and steady at the top
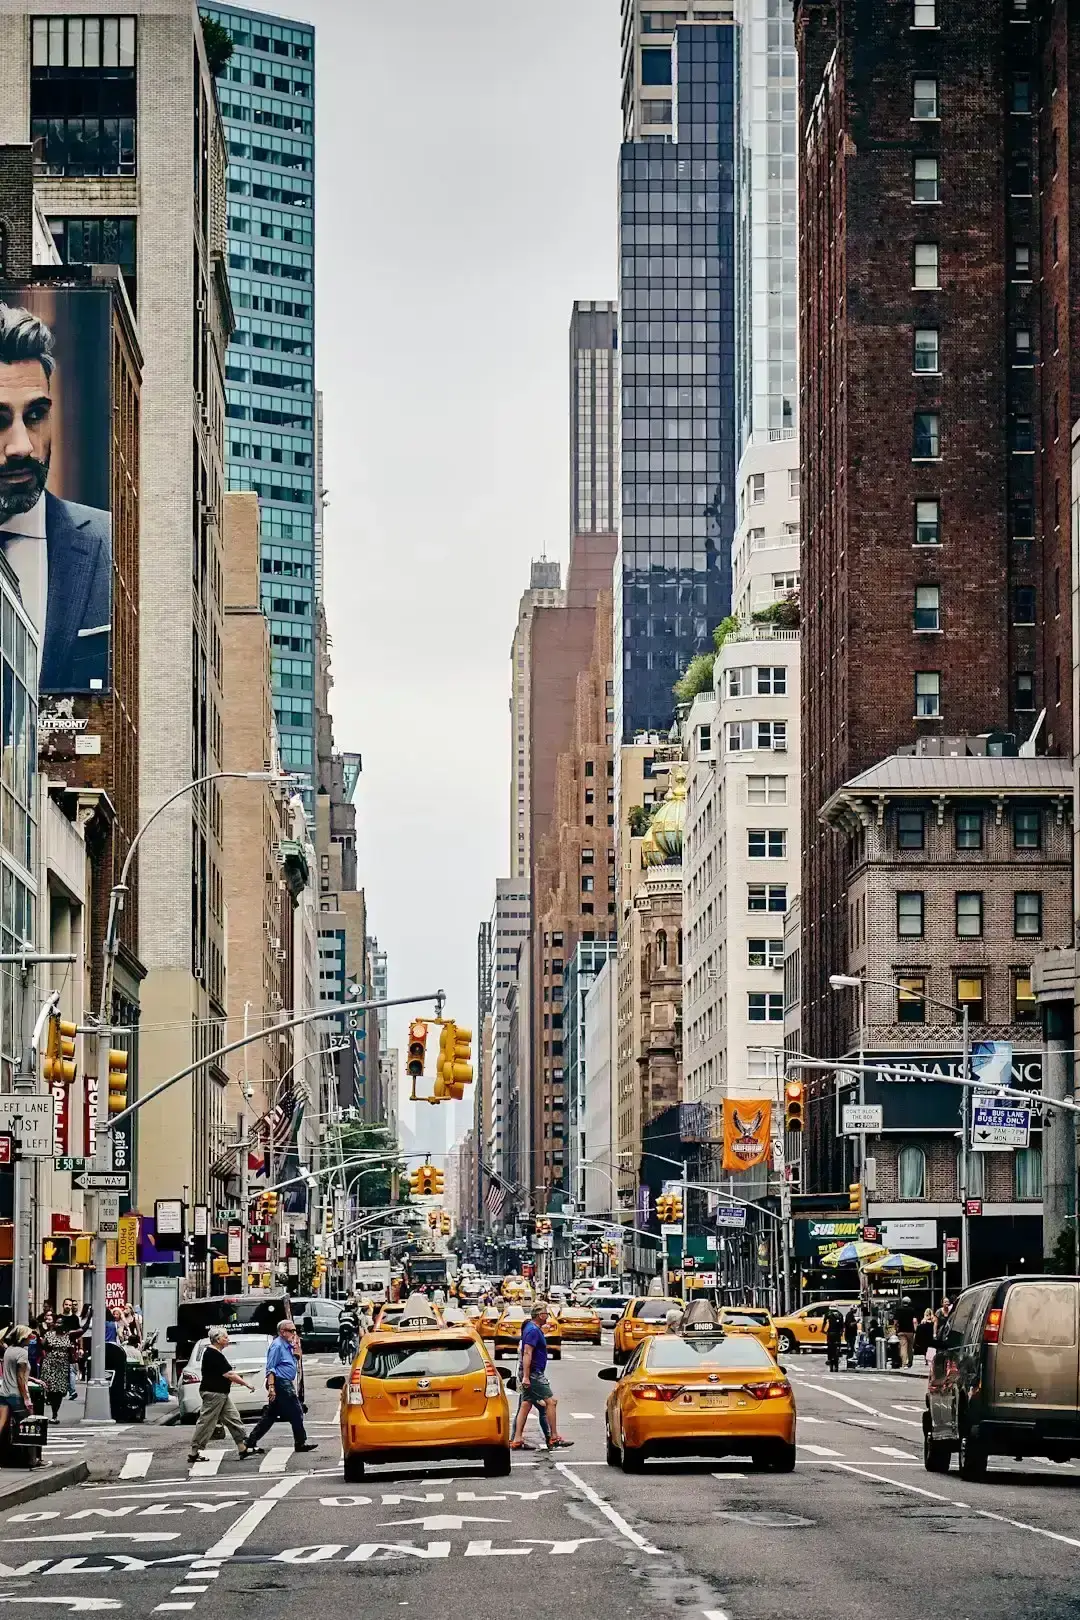
New York didn’t get worse in 2025, but it didn’t need to. It was already bad enough to hold its ground near the very top of nearly every ranking. Drivers in NYC lost 102 hours in 2025, the same as last year, with these delays costing the average driver $1,879 and the city $9.7 billion. By a different measurement, the picture looks even starker.
New York City held onto its title as the slowest city in America for the second consecutive year, with drivers losing an average of 120 hours to traffic in 2025 based on a six-mile commute during peak hours. There is a bit of a silver lining, though. New York City started addressing its congestion issues by introducing congestion pricing in 2024, charging many drivers entering Manhattan’s congestion relief zone a once-per-day toll of $9 during peak hours. Early results suggest the policy is having a real effect, with New York City DOT reporting that crashes dropped 14%, injuries fell 15%, and pedestrian fatalities reached their lowest levels since 2018 inside the zone.
Philadelphia, Pennsylvania: The fastest-rising gridlock
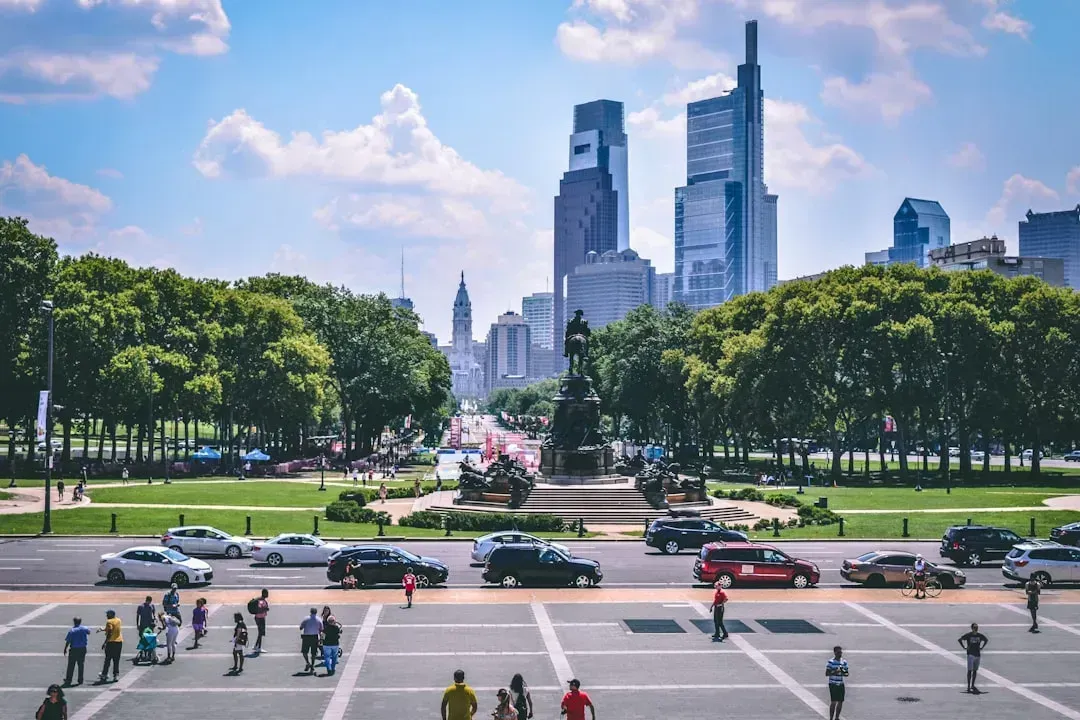
If Chicago wears the crown, Philadelphia is the city that got there the hardest and fastest. Commuters in Philadelphia lost an average of 101 hours to extended travel in 2025, placing it third in the United States, surpassed only by Chicago at 112 hours and New York at 102. What stands out isn’t just the ranking but the trajectory. Philly recorded one of the largest increases in congestion among all the major US cities INRIX looked at, with traffic delays jumping by 31% compared to 2024, a rapid rise that took the city up two spots from its previous fifth-place ranking.
This kind of sudden jump usually points to shifting commuting patterns rather than new roads suddenly disappearing. Many employers in the region tightened return-to-office policies through 2025, pushing more cars back onto corridors that had gotten used to lighter traffic. Philadelphia’s growing congestion is part of a larger trend in America, with many other large urban regions seeing similar jumps thanks at least in part to widespread return-to-office orders. For a city already dealing with aging infrastructure, that kind of volume increase lands hard.
Los Angeles, California: A reputation that still holds, by a different measure
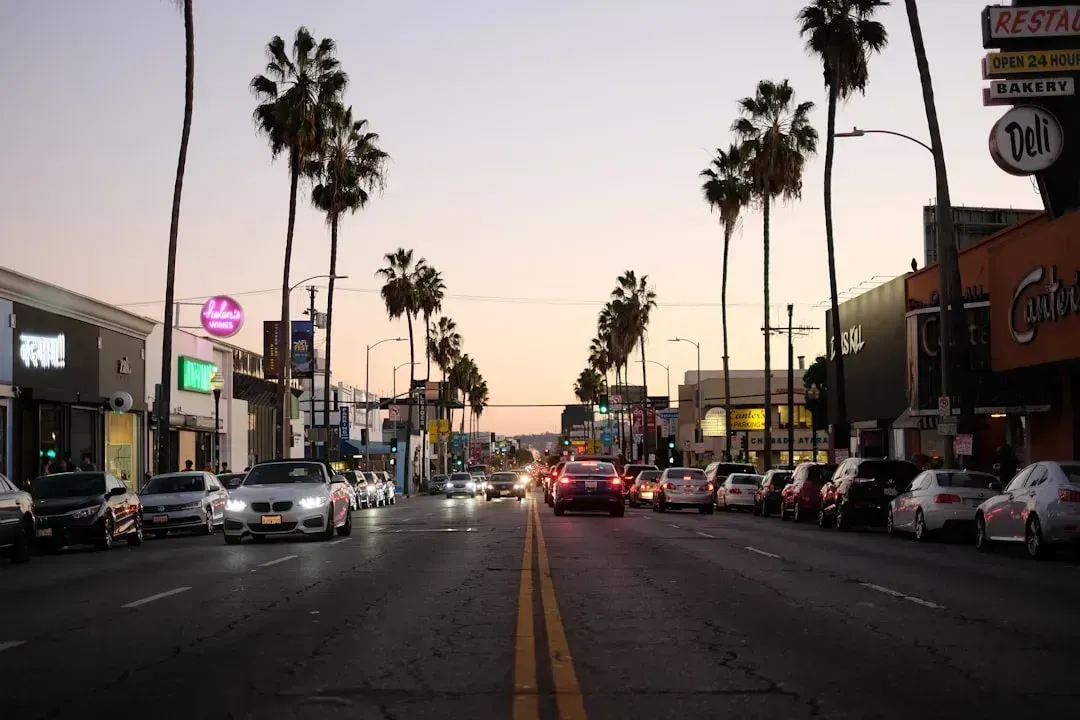
Los Angeles has long been the poster child for gridlock in the American imagination, and depending on which dataset you check, that reputation is either overstated or completely justified. By total hours lost, LA actually ranks behind Chicago, New York, and Philadelphia. Los Angeles has such a bad reputation for its heavy traffic and packed freeways, but it actually ranked fourth on INRIX’s list of the most congested US cities, though millions of residents still commute around the city every day, with its enormous web of highway networks always getting overwhelmed during peak travel periods.
Where LA does reclaim the top spot is in a different kind of measurement entirely. The 2025 TomTom Traffic Index found Los Angeles ranking as the most congested city in the U.S. by congestion level, with New York remaining the slowest for average travel speeds. With nearly a 60% average congestion level, Los Angeles ranked as the most congested city in the U.S., followed by Honolulu and San Francisco. The difference comes down to methodology. TomTom measures how much slower streets are compared to free-flow conditions, while INRIX tracks raw hours lost, and Los Angeles’ sprawling road network happens to score worse on the first metric than the second.
Boston, Massachusetts: Old streets, new delays
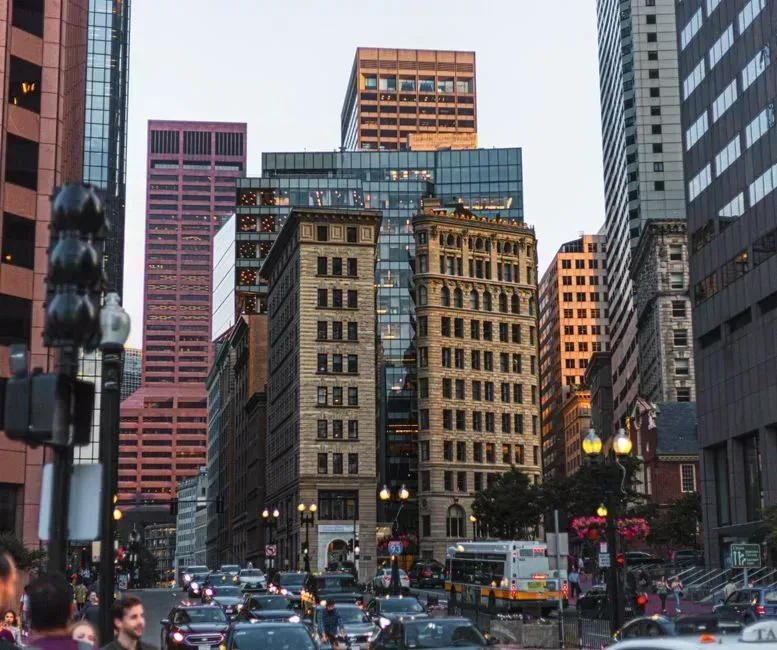
Boston’s tangled colonial-era street grid was never built with modern traffic volumes in mind, and the numbers reflect that mismatch. Boston rounds out the top five most congested U.S. cities, with drivers losing 83 hours to traffic in 2025. That places it firmly in the same conversation as much larger metro areas, despite Boston having a fraction of the population of Chicago or Los Angeles.
Interestingly, Boston is one of the few major metros bucking the national trend of worsening congestion. Atlanta recorded the largest year-over-year increase in congestion among the top 10 cities, while Boston saw a notable decline. Out of the top 10, Atlanta had the largest increase of four percentage points, while New York City stayed flat and Boston declined by three points. Even with that modest improvement, Boston commuters are still stuck dealing with narrow, historic roadways that simply cannot absorb more cars no matter how efficient traffic management becomes.
Washington, D.C.: Government gridlock, literally
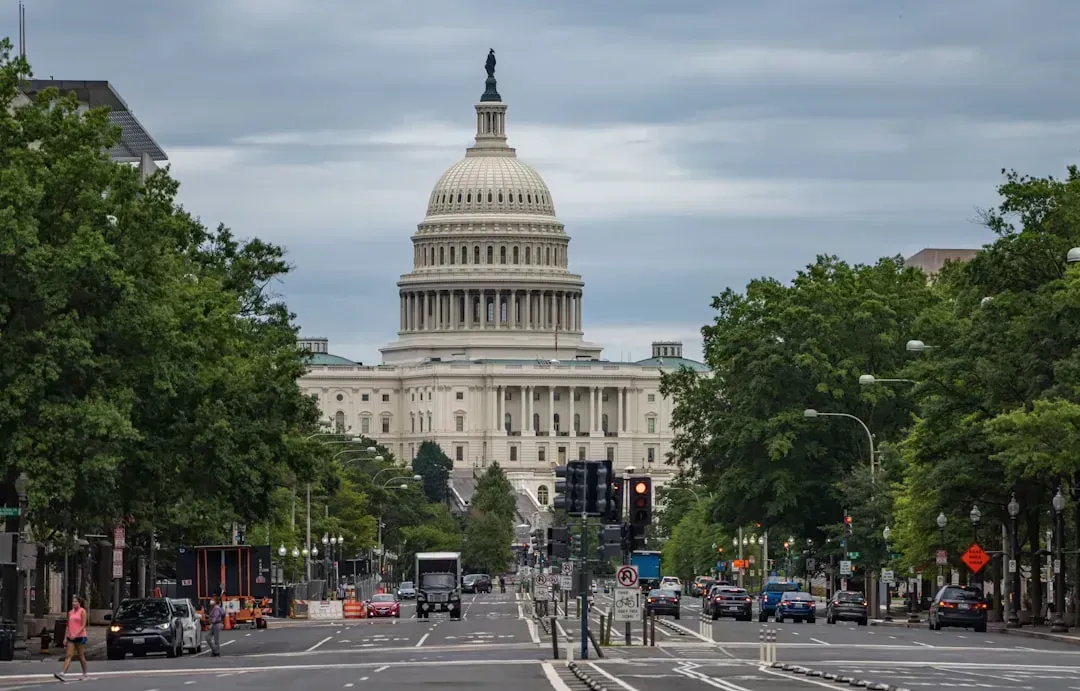
The nation’s capital has its own particular brand of congestion, driven by a dense federal workforce, tourist traffic, and a road network that funnels people through a handful of key bridges and avenues. Drivers in Washington, D.C. sit in about 70 hours of traffic on average a year, according to the INRIX study. Out of U.S. cities alone, D.C. is ranked 9th, with congestion costing drivers $1,289 in the district.
D.C. does have one bright spot when it comes to alternatives to sitting behind a wheel. Shared scooters and bikes have continued to see upward growth in large cities like Seattle and Washington D.C., with D.C. seeing a 48% jump. That growth suggests at least some residents are opting out of the daily grind when they can, even if it barely dents the overall numbers for a metro area this large.
Baltimore, Maryland: A quiet city with a loud traffic problem
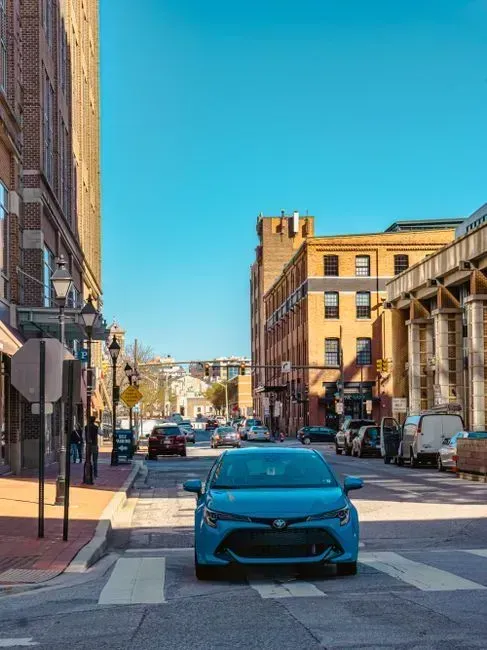
Baltimore rarely gets mentioned in the same breath as Chicago or Los Angeles, but its 2025 numbers tell a story of quietly worsening conditions. The company’s analysis found that 62% of urban areas suffer longer travel delays than were recorded in 2024, led in the U.S. by Baltimore and Philadelphia with 21% increases. That kind of jump in a single year is significant for a metro area of Baltimore’s size.
What makes Baltimore’s situation a bit unusual is that the sharp increase didn’t actually move its position in the national rankings. Baltimore had a similar 31% spike in delays year-over-year, but its ranking didn’t move an inch, remaining in the same #13 spot for 2025 that it ended up in for 2024. In other words, traffic got noticeably worse across the board, and Baltimore simply kept pace with everyone else’s decline rather than falling further behind.
San Francisco, California: Tech hub, traffic hub
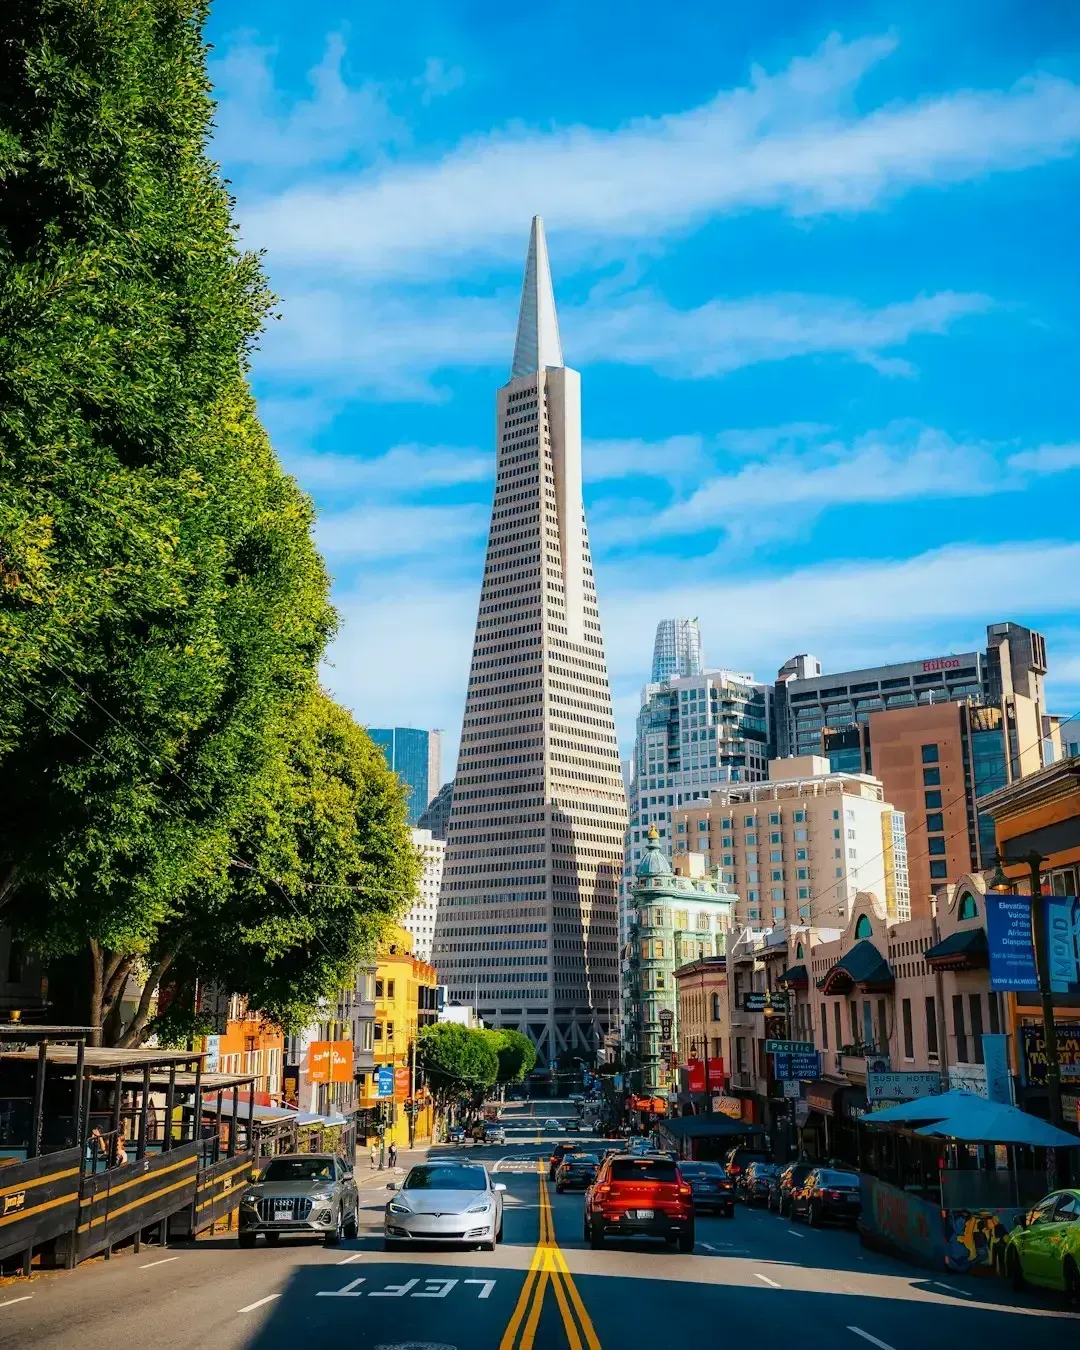
San Francisco’s compact footprint and hilly geography have always made it a tricky city to drive through, and 2025 data confirms that reality is only intensifying. San Francisco ranked third among the most congested U.S. cities by congestion level, at nearly 50 percent, according to the TomTom Index. New York remained the slowest overall city in the U.S. for a second year in a row, followed closely by San Francisco and distantly by Philadelphia and Honolulu.
Part of what makes San Francisco’s traffic story different from other cities is timing rather than just volume. Tech-centric metros such as San Francisco, San Jose, Seattle, Austin, Boston, and Denver continue to lag behind 2019 congestion levels and displayed the most pronounced midweek surges. That pattern lines up with hybrid work schedules common across the Bay Area’s tech workforce, where employees cluster their office days midweek rather than commuting five days straight.
Miami, Florida: Sunshine and standstills
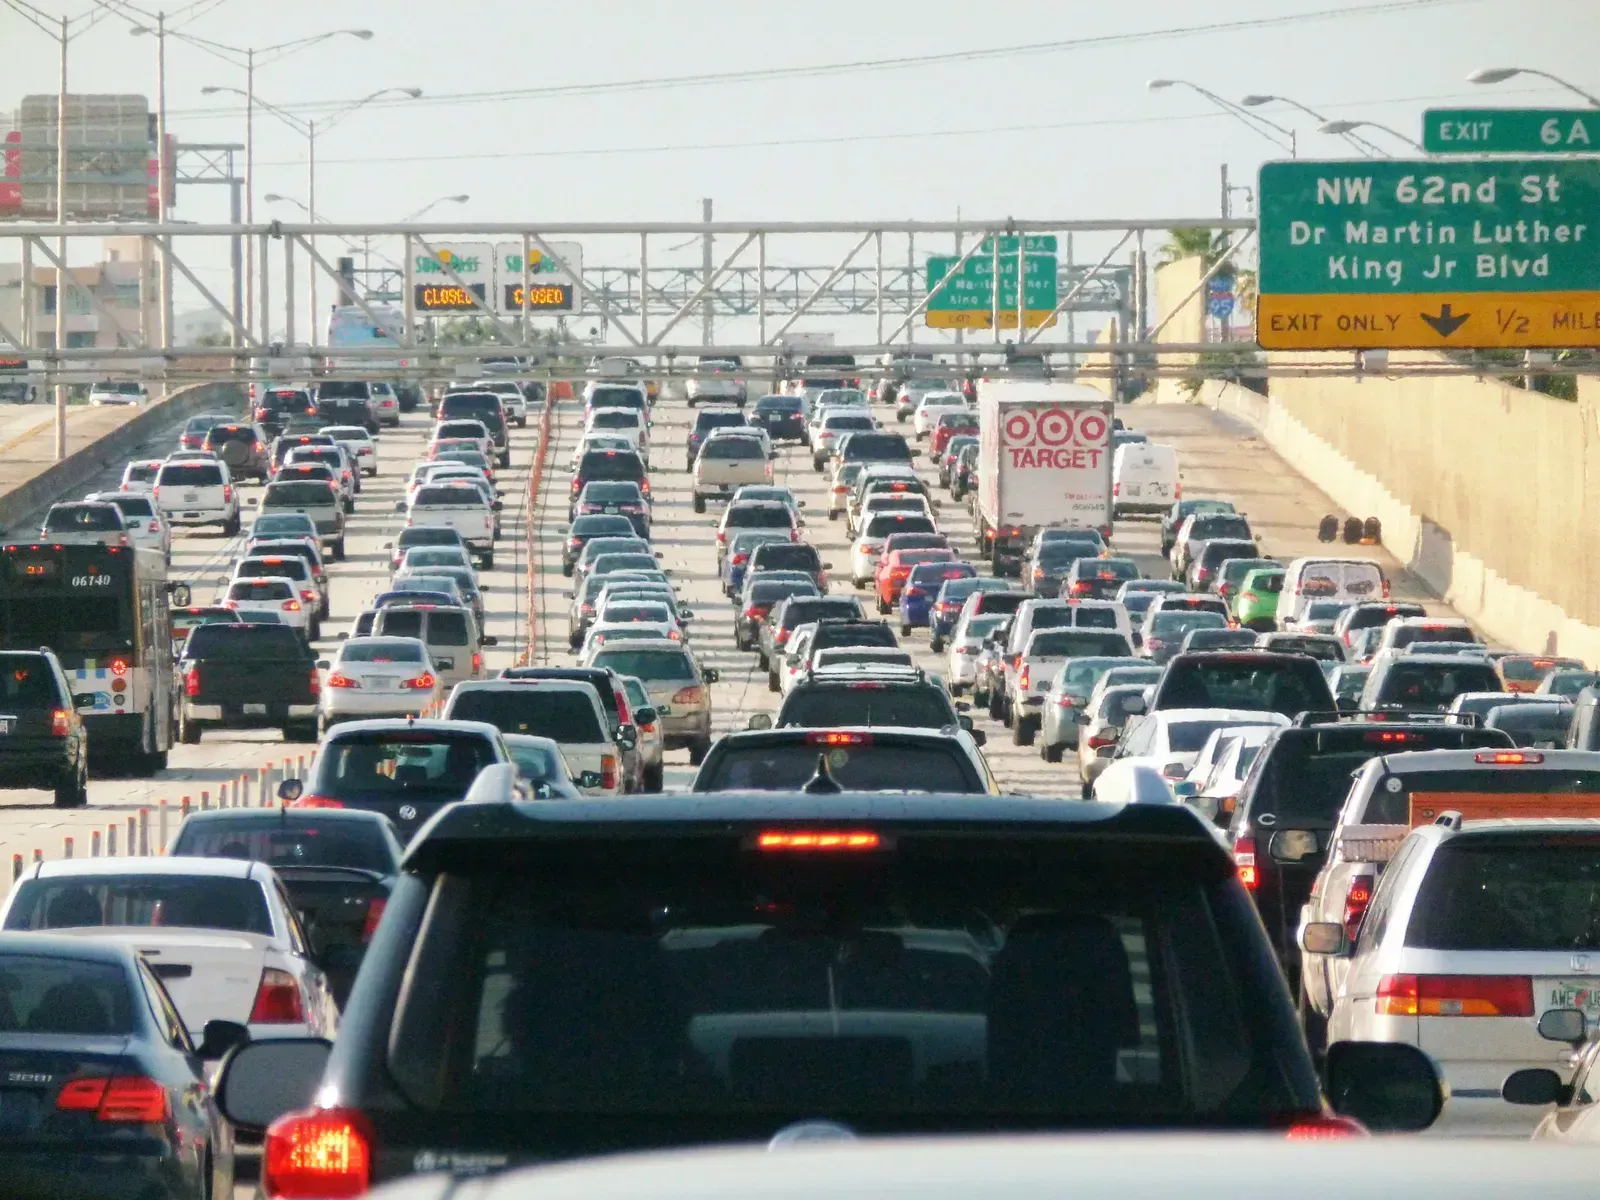
Miami’s traffic problems don’t get the same national attention as those in New York or Los Angeles, but the data places it firmly among the country’s most congested metro areas. Miami ranked fifth among the most congested U.S. cities by congestion level, at nearly 47 percent, according to the TomTom Index. That puts it ahead of cities like Chicago and Seattle on this particular measure, a fact that surprises plenty of people who assume Sun Belt cities have more breathing room.
Rapid population growth across South Florida in recent years has only added pressure to a road system that was already stretched thin. New residents drawn by warmer weather and no state income tax have brought more cars without a matching expansion in highway capacity. The result is a metro area where congestion now rivals older, denser cities that built their infrastructure decades earlier for a fraction of today’s population.
Atlanta, Georgia: The fastest growing headache
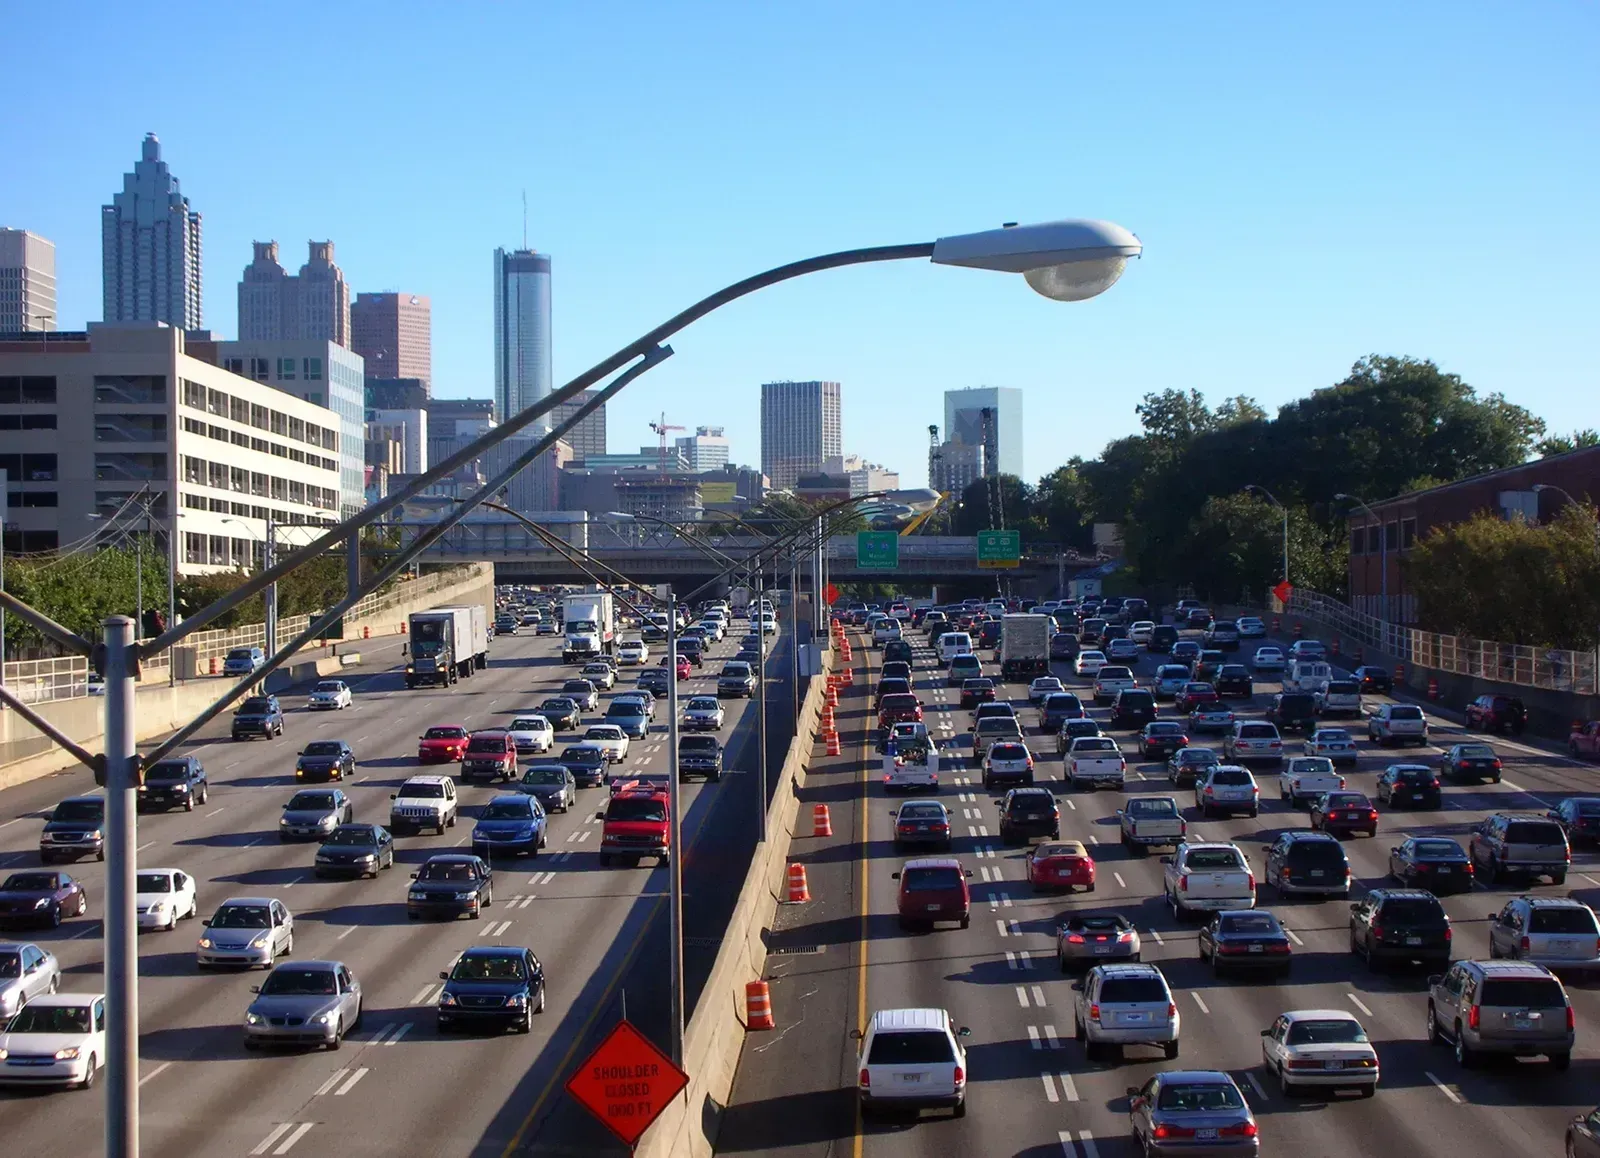
Atlanta’s sprawling metro area has earned a reputation for brutal commutes, and 2025 confirmed that things are trending in the wrong direction faster than almost anywhere else. Atlanta recorded the largest year-over-year increase in congestion among the top 10 cities in the country. Out of the top 10, Atlanta had the largest increase of four percentage points.
Atlanta’s low-density, highway-dependent layout means residents often have few practical alternatives to driving, unlike commuters in cities with more developed rail or bus systems. Atlanta ranked eighth among the most congested U.S. cities by congestion level, at just over 44 percent, according to the TomTom Index. With the region continuing to attract new residents and businesses, there’s little reason to expect that upward trend to reverse on its own anytime soon.
The bigger picture behind the wheel
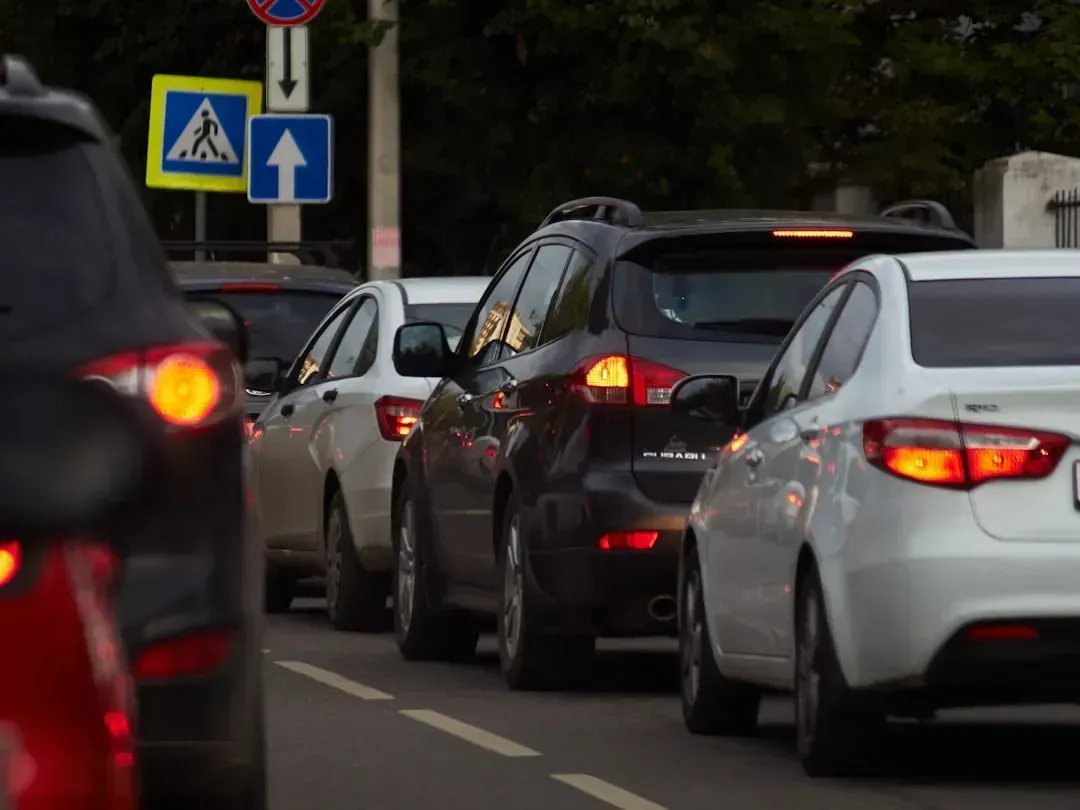
Zooming out from any single city, the national trend is impossible to ignore. The typical U.S. driver lost 49 hours to traffic congestion in 2025, an 11% increase from 2024, with congestion costing the U.S. around 4.7 billion hours, or nearly $86 billion in lost time. Several forces are converging to push those numbers higher. Congestion increased in 254 of the 290 U.S. cities analyzed as travel returned to pre-COVID congestion levels, with the percentage of people commuting by car nearly back to 2019 levels while public transit remains down 22% from 2019.
Housing costs are playing an underappreciated role in stretching commutes even longer. Beyond growing travel demand, rising housing costs are pushing many workers farther from job centers, contributing to the rise of so called super commutes. At the same time, the roads themselves aren’t getting fixed fast enough to absorb the extra demand. Billions in infrastructure spending have struggled to keep pace with demand, as aging bridges, major construction corridors, and delayed upgrades continue to amplify delays, particularly in fast growing metro areas. For millions of Americans, that combination of more cars, longer distances, and slower repairs adds up to the same frustrating reality every single weekday.



Leave a Reply