Most people accept that rush hour is unpleasant. What fewer people expected is that it would start reshaping where they live, where their children go to school, and whether they even want a job near a city center at all. Traffic in the United States has quietly crossed a threshold from mere inconvenience into something that meaningfully alters daily decisions for millions of Americans.
If it seems like traffic is getting worse where you live, that’s because it probably is. After dropping during the COVID-19 pandemic, congestion climbed to record levels in 2024, researchers say. The numbers behind that trend are striking, and the cities driving it are familiar names – though the severity of what’s happening inside them is anything but ordinary.
Chicago: America’s Most Congested City, and It’s Not Even Close
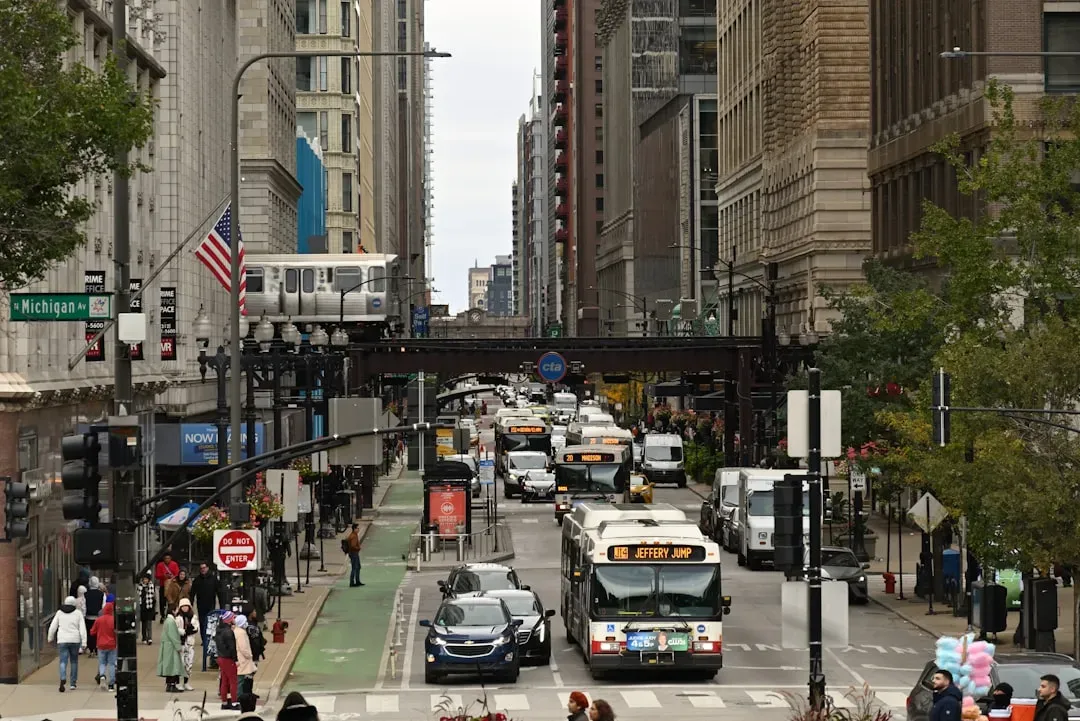
Chicago, the Midwest’s largest metro, claimed the unfortunate title of most traffic-congested city in the U.S. In fact, traffic was so severe that the Windy City also ranked third worst globally, according to INRIX data. That’s a remarkable distinction for a city that isn’t typically grouped alongside the infrastructure struggles of coastal megacities.
Chicago drivers lost an incredible 112 hours sitting in traffic, a 10% increase from the year before. Those delays came at a steep price, costing each commuter an estimated $2,063 in lost time. That’s about a $7.5-billion hit citywide. The persistent issue is influencing long-term transportation planning that now includes several major investments in transit projects and policy changes.
New York City: Where Congestion Pricing Changed the Calculus
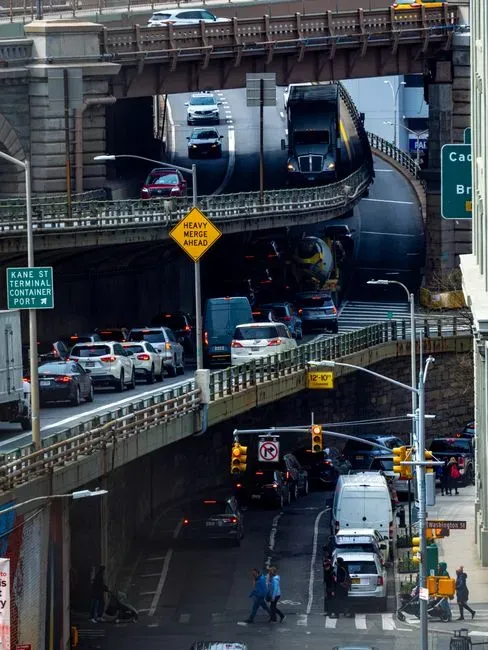
In New York City, the average driver lost 102 hours to congestion in 2024, over four days, costing commuters $1,800 over the course of the year. That’s roughly an entire work week spent sitting still, not moving toward any goal, simply waiting. The city has long been synonymous with gridlock, but what’s new is how residents are responding.
Congestion levels in New York City remained flat in 2025, likely due to the city’s new congestion pricing policy. Peak speeds there dropped to 15 mph during the worst parts of the morning and afternoon rush hour, with downtown last-mile routes averaging just 11 mph during the morning commute. The policy intervention appears to be working, at least modestly, though its effects on where people choose to live remain an open and evolving question.
Los Angeles: The City That Practically Invented the Traffic Problem
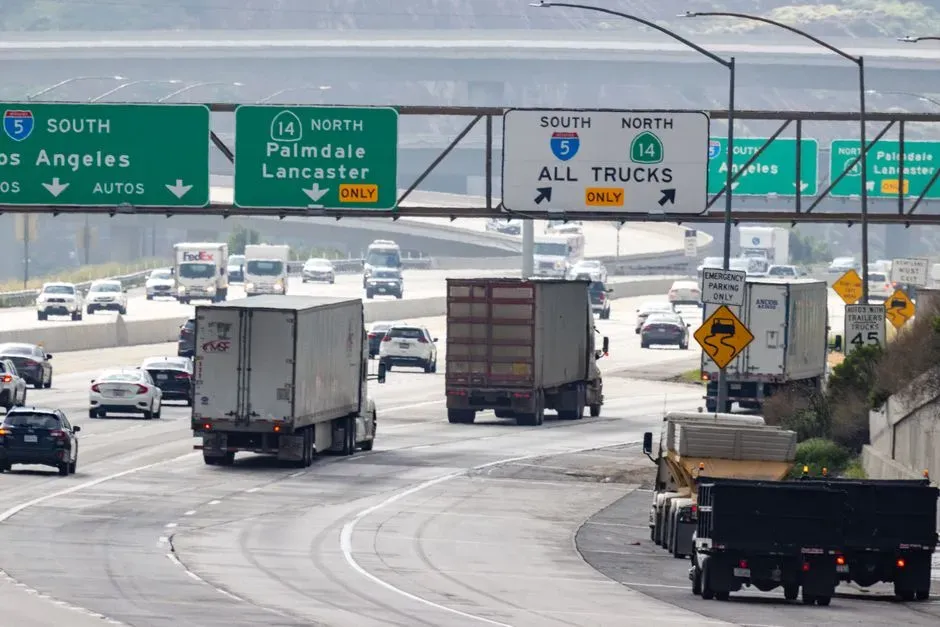
Researchers say the average driver in Los Angeles lost 137 hours to traffic delays in 2024, the most of any U.S. city by some measurements, depending on the methodology used. The TomTom Traffic Index placed Los Angeles at the top for worsening congestion levels, ranking it worst for the average additional time lost to traffic in 2024.
Los Angeles still had the longest weekday congestion time of any major city, at almost eight hours. That means for much of the working day, LA’s roads are measurably slower than free-flow conditions. The city is already planning for the World Cup’s influx of traffic and commuters in 2026, a stress test that will reveal just how fragile the region’s road network already is.
Philadelphia: The Fastest-Growing Congestion Crisis
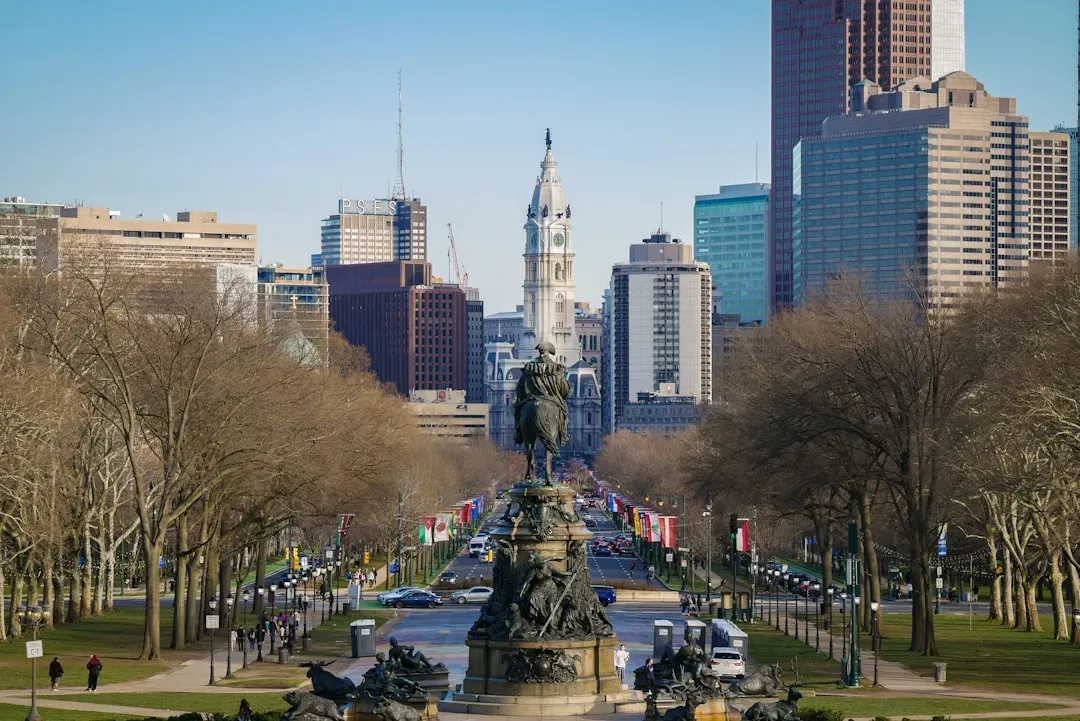
Philadelphia ranked among the top five most congested cities in the United States, with drivers losing 101 hours annually to traffic delays. The city sits just behind Chicago and New York, which is a troubling position for a metro that doesn’t always attract the same level of national attention on this issue.
Philadelphia and Baltimore saw the largest year-over-year increases in congestion at 31% in 2025, a surge that outpaced nearly every other major American metro. Chicago appears five times in the top 10 most congested roads nationally, though several of these corridors experience peak slowdowns with some segments losing over 30 minutes of travel time daily. These delays add up quickly for commuters, especially in areas with limited alternative routes or transit options.
Boston: Where Geography Makes Everything Worse
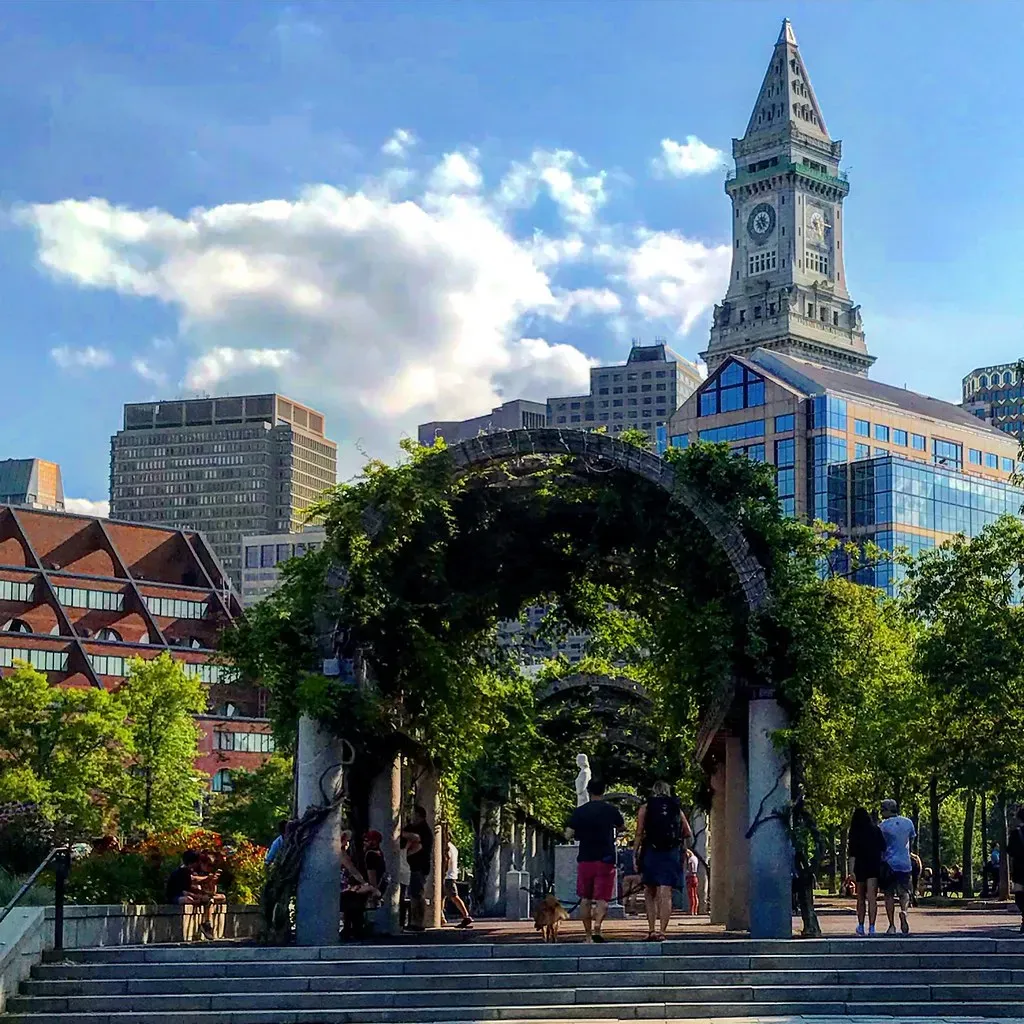
Boston rounds out the top five most congested U.S. cities, with drivers losing 83 hours annually. Its compact colonial-era street grid, combined with one of the country’s most densely developed urban cores, creates a particular kind of gridlock that no amount of signal optimization fully resolves. The geography simply isn’t built for the volume of vehicles using it.
Traffic congestion has been linked with higher levels of air pollution, which can significantly affect health. Those in cities with higher rates of congestion, where travelers sit in their cars surrounded by exhaust fumes, could be at greater risk of developing air pollution-associated health issues. In a city like Boston, where so many residents are packed into a relatively small area, those health implications reach well beyond the highway itself.
Seattle: When Corporate Mandates Collide With Gridlock
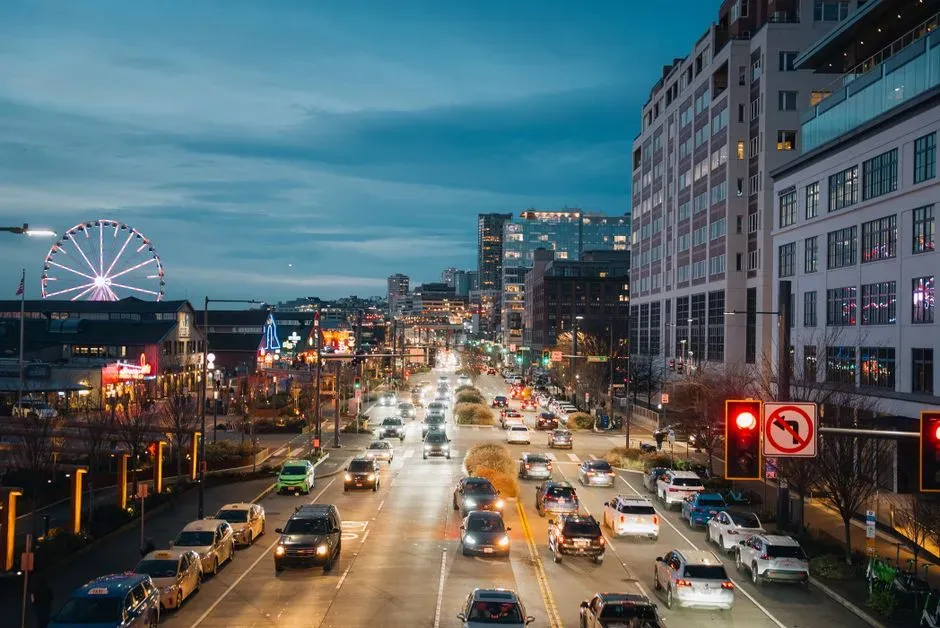
Seattle drivers spent more time in traffic in 2025 than in 2024, as construction on major corridors continued and remote work ebbed. The typical driver in the metro region lost 68 hours to traffic congestion in 2025, up 8% from 63 hours the prior year, and 19 hours more than the national average.
Some notable employers told their employees to return to the office, including Amazon, which required employees to work in-person five days a week, and Microsoft with its three-day-a-week mandate. The shift to telecommuting, and the more recent reversion to in-office work, was more noticeable in West Coast cities like Seattle, which have less diverse economies compared to places like New York and Chicago. Residents are increasingly weighing whether living closer to downtown is worth what it costs to rent there, or whether commuting from further out is worth the time.
San Francisco: Tech’s Return to Office Is Clogging the Bay
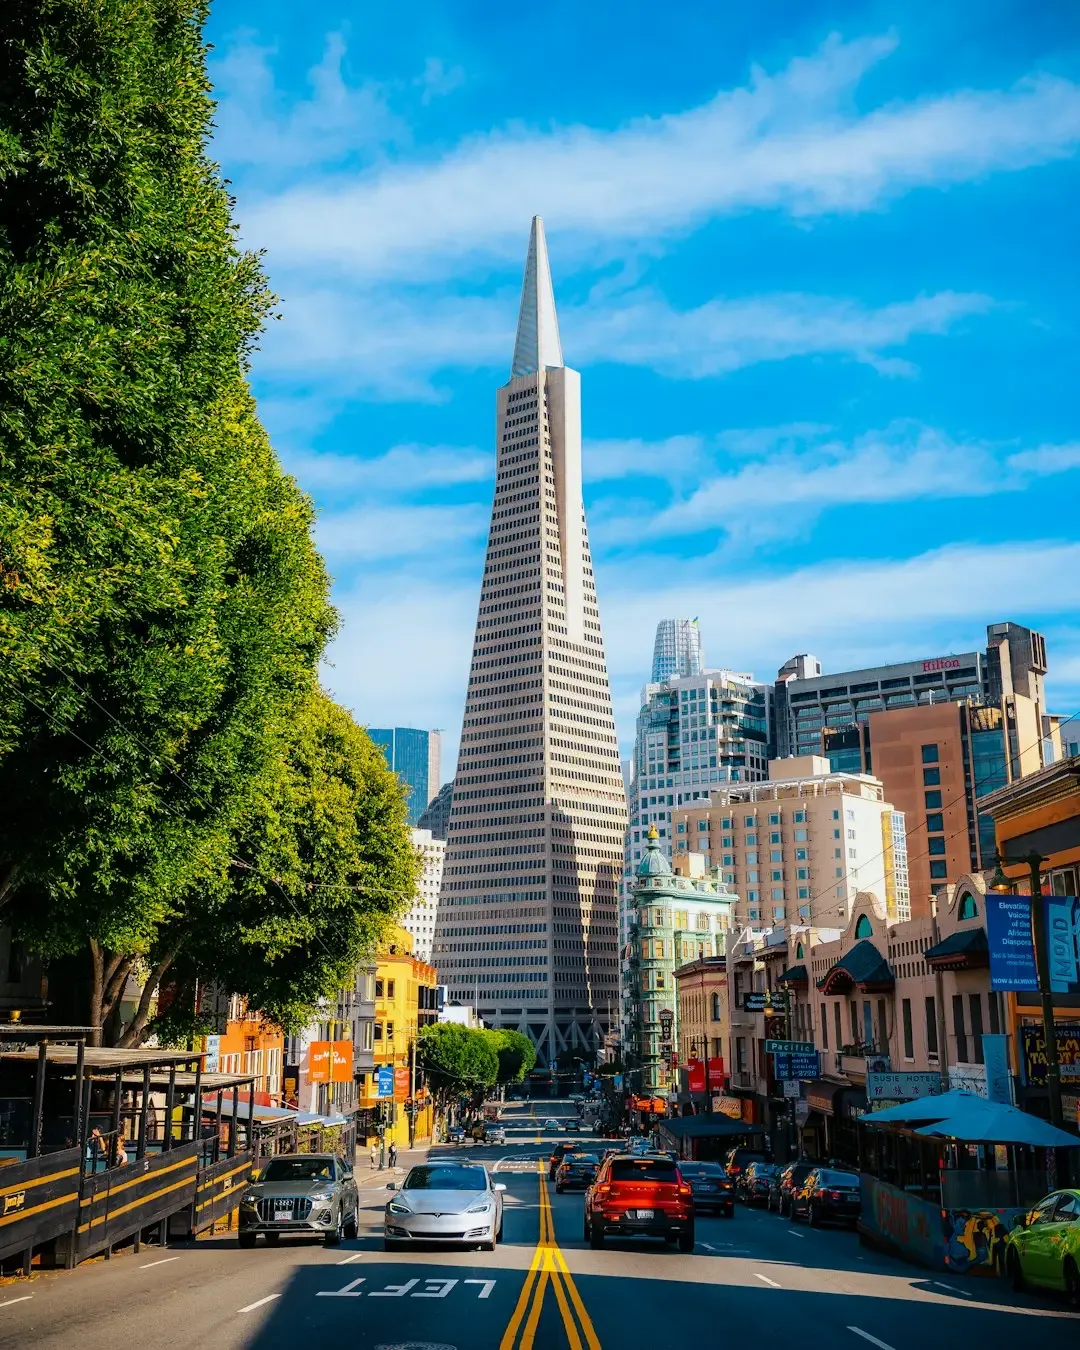
San Francisco ranked second-worst for average travel time in the U.S. in 2024, with drivers taking 25 minutes and 37 seconds for a six-mile trip. It was followed by Honolulu, Chicago, and Philadelphia. The city’s geography, hemmed in by water and hills, leaves few options for rerouting when key corridors back up.
A pullback of remote and hybrid work models, specifically in tech-heavy areas like San Jose, San Francisco, and Seattle, brought a large jump in downtown trips. Significant bottlenecks include the Brooklyn-Queens Expressway and major congestion points in Orlando, San Francisco, and Chicago, according to INRIX’s 2025 Scorecard. For San Francisco specifically, the interplay between expensive housing, tech employer mandates, and limited road capacity has made the daily commute a genuine quality-of-life issue that factors into relocation decisions.
Washington, D.C.: A Rare Case of Congestion That Actually Improved
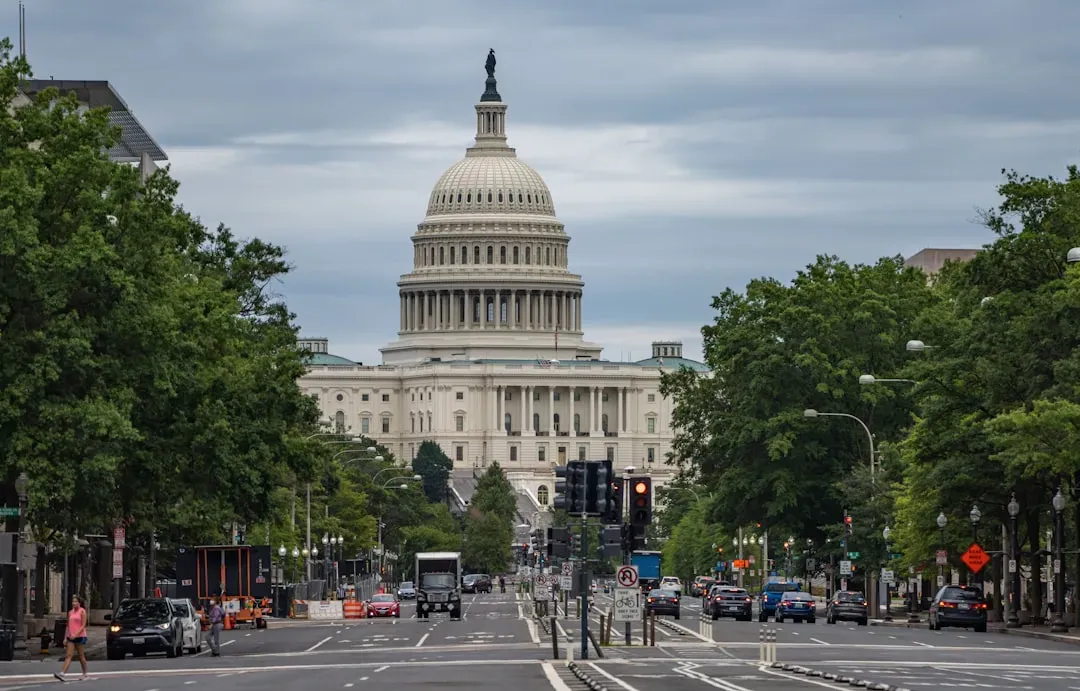
According to annual traffic rankings, the average commute time in Washington, D.C. was found to be 33.4 minutes, the longest in the country. The city was also found to have an average weekday congestion of 6.5 hours, which equates to spending 71 days of the year in traffic. Those numbers have long defined life in the region, affecting everything from dinner plans to decisions about which suburb to settle in.
Researchers at Texas A&M identified a few regions where congestion is down compared with before the pandemic, most notably Washington, D.C., a result that could be linked to the persistence of remote work in the federal government in 2024. It might also have something to do with regional efforts to fight congestion, including a tolling strategy known as dynamic pricing. Whether that improvement holds as federal return-to-office policies tighten remains to be seen.
The Structural Forces Making It Worse Everywhere
Beyond growing travel demand, structural factors are intensifying congestion pressures. Rising housing costs are pushing many workers farther from job centers, contributing to the rise of so-called “super commutes.” This is a feedback loop that planning experts have flagged for years: unaffordable housing near employment centers forces longer drives, which worsens the very roads that make those neighborhoods attractive in the first place.
Public transit has not made the same recovery as car commuting and is down 22% from 2019 levels. More than three-fourths of people in U.S. cities commute by car, significantly outweighing other modes. Just 13% of people work from home, 4% take public transit, and 5% rely on other modes like taxis, walking, and cycling. With those proportions, every additional worker returning to the office means another car on roads that were already over capacity.
How Traffic Is Reshaping Daily Life Across These Cities
According to the May 2024 Survey of Working Arrangements and Attitudes, over half of respondents cited traveling to and from work as a key factor in their attitudes toward returning to the office. Commute time has become a deciding factor not just in career choices but in housing searches, school district preferences, and even relationship geography in major metro areas.
Congestion effects are reflected in decisions about business location and expansion, home and job sites, school, doctor visits, recreation, and social events. When cities widen a highway, that encourages more people to drive on it, returning congestion to the original levels within a few years – a well-documented phenomenon known as induced demand, which helps explain why more road capacity has not solved the problem in any of these cities. The traffic isn’t just slowing people down anymore. It’s quietly redirecting how and where entire communities choose to exist.

Leave a Reply