
Newark Liberty International Airport
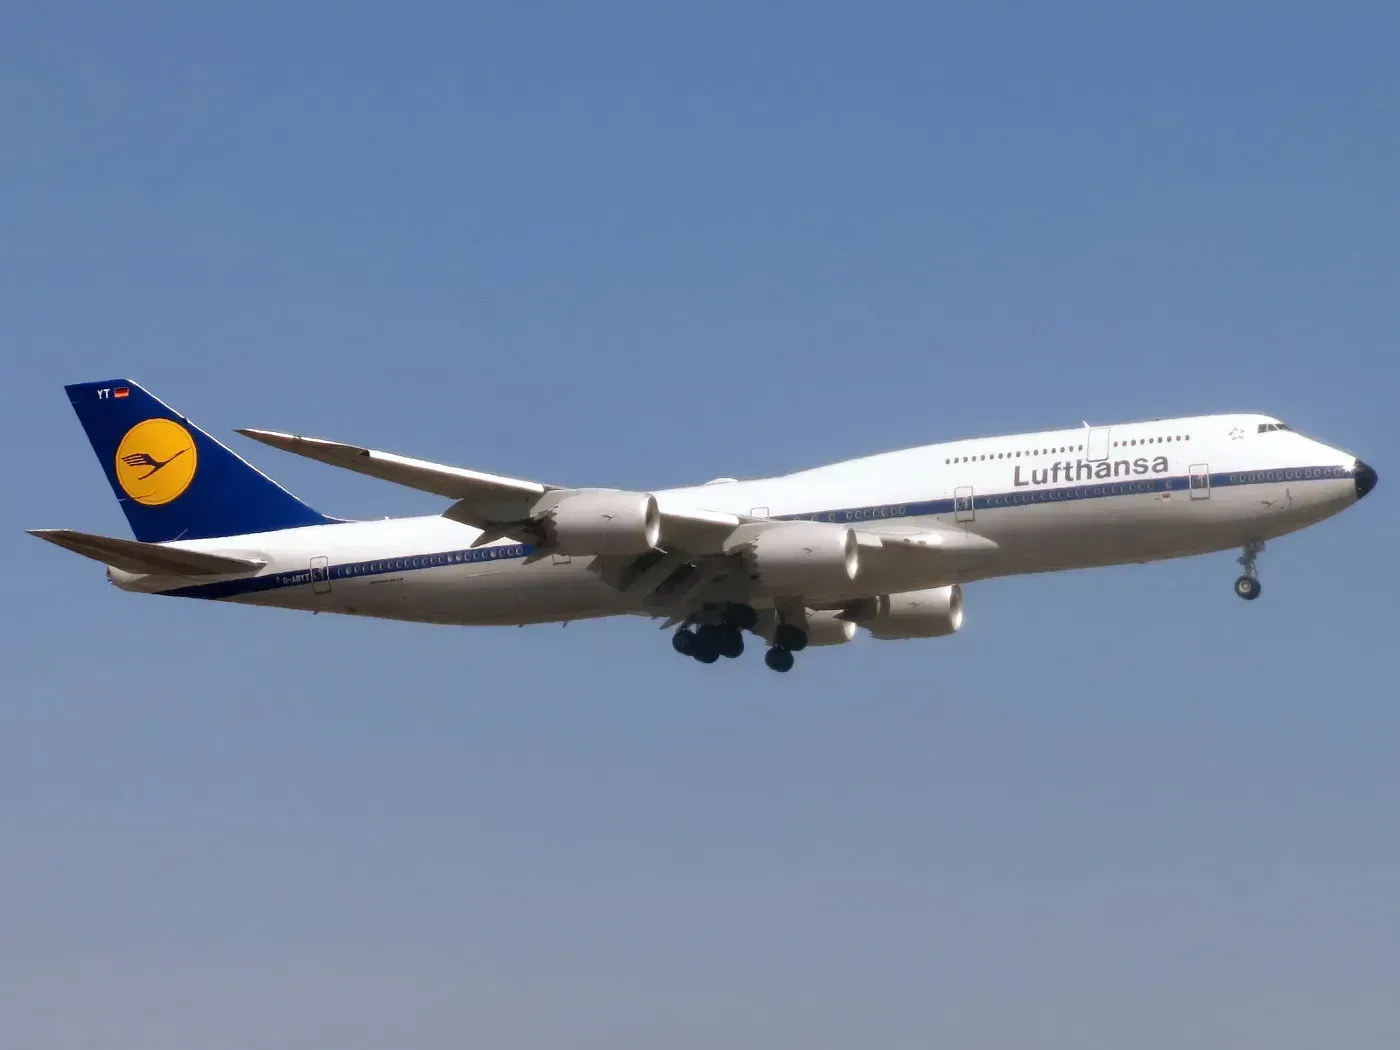
Newark has become something of a cautionary tale in aviation circles. A shortage of air traffic controllers, repeated radar and communications outages, and runway construction combined to push its May 2025 on-time rate down to 49.21%, essentially a coin flip. The FAA didn’t just let that slide either.
The agency responded by capping the airport at 72 total movements per hour, a limit that remains in force into late 2026 to keep the schedule survivable while controller hiring catches up. When a delayed flight does leave, the wait tends to sting: a delayed departure at Newark drags on for more than 84 minutes on average.
Ronald Reagan Washington National Airport
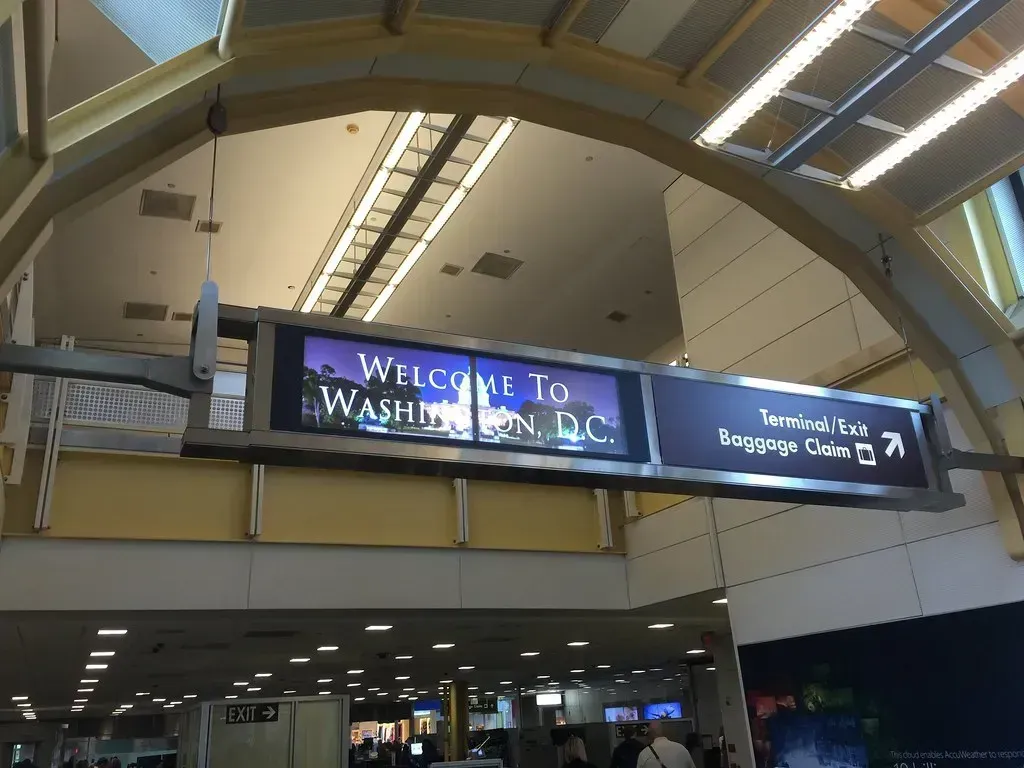
DCA holds an unfortunate title among the nation’s thirty busiest hubs. Ronald Reagan Washington National is the worst airport in America for delays in 2026, with just 68.3% of flights on time across 2025 according to Bureau of Transportation Statistics data, the lowest of the 30 busiest US hubs. That’s a meaningful gap below the national baseline.
For context, the national average was 76.42% in 2025, itself a slide from 78.1% the year before. Constrained runway space and a compact footprint near the Potomac leave little room for the airport to absorb bad weather or traffic bunching without the whole day slipping.
LaGuardia Airport
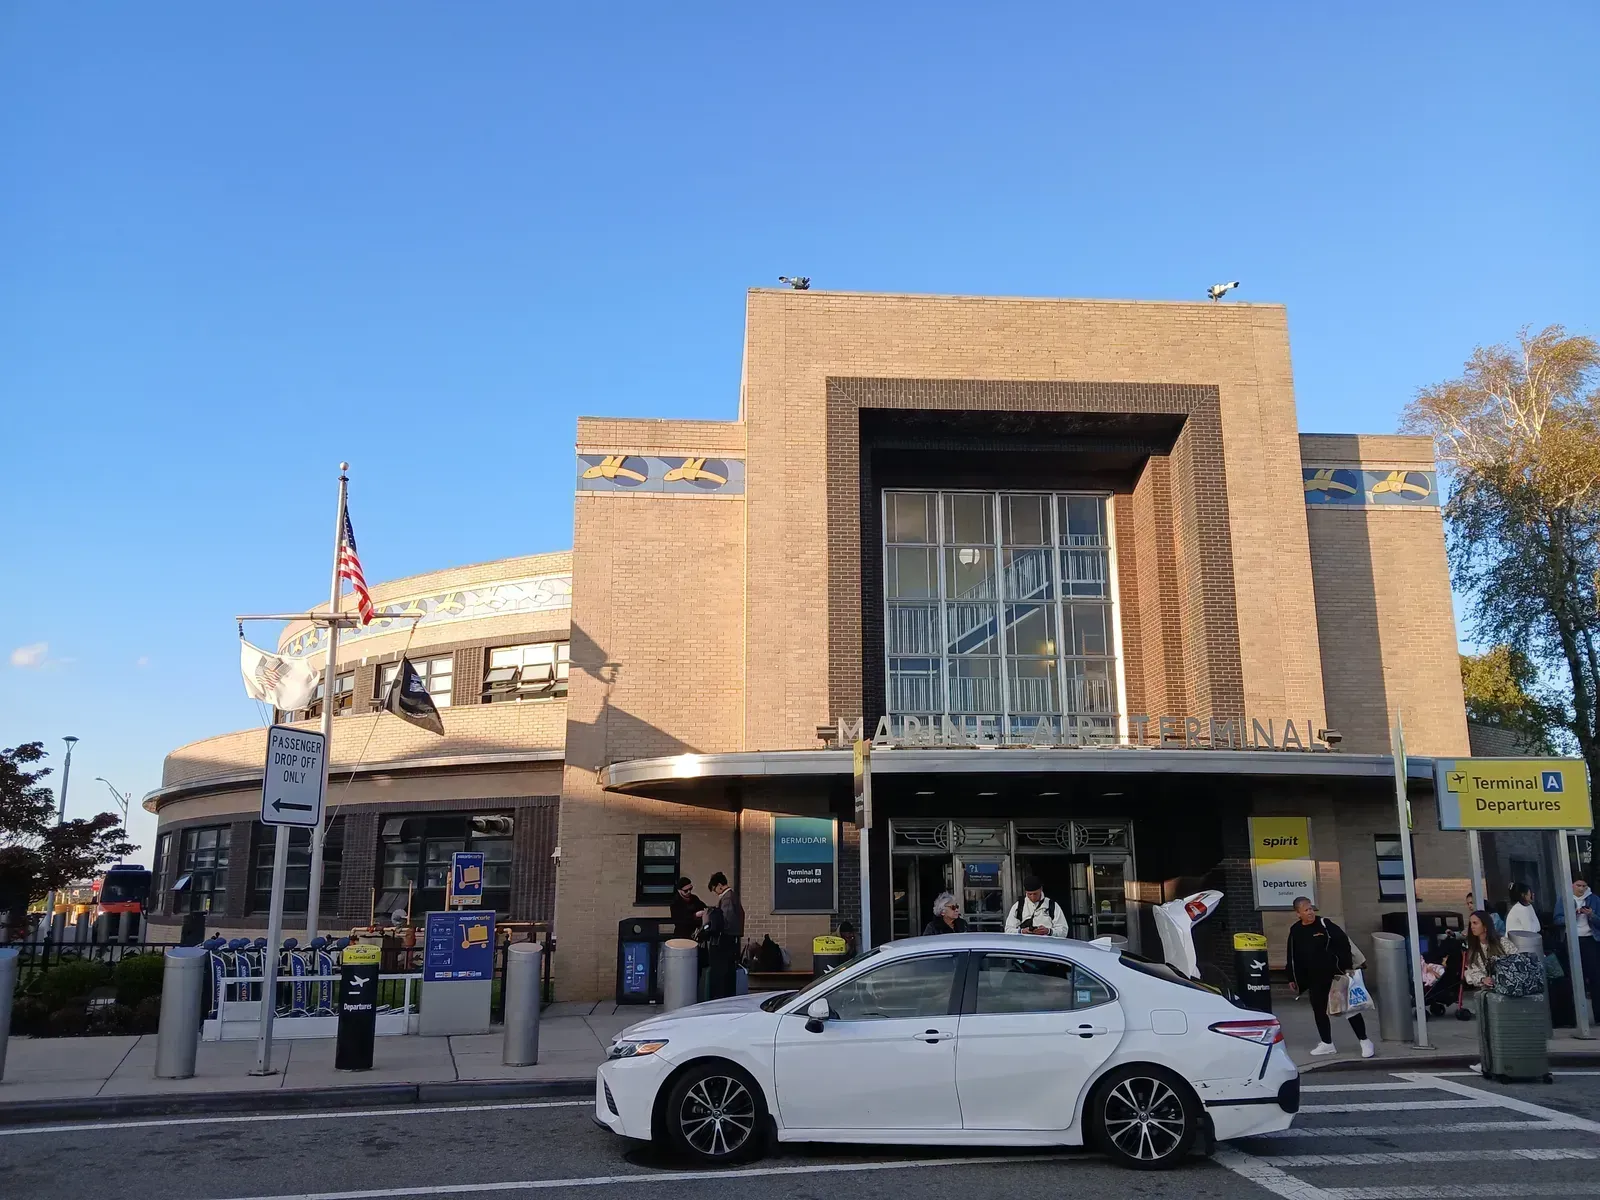
New York’s smaller in-city airport carries its own reputation for testing patience. LaGuardia isn’t far behind Newark, with delayed departures running over 81 minutes on average. Given how tightly packed the airfield is and how much traffic funnels through the New York airspace corridor, one hiccup upstream tends to ripple through the rest of the day quickly.
Travelers who fly LaGuardia regularly have learned to build in extra buffer time, especially on evening flights when the day’s delays have already stacked up. It’s rarely a single bad decision that causes the wait, more a system running at capacity with little slack.
Chicago O’Hare International Airport
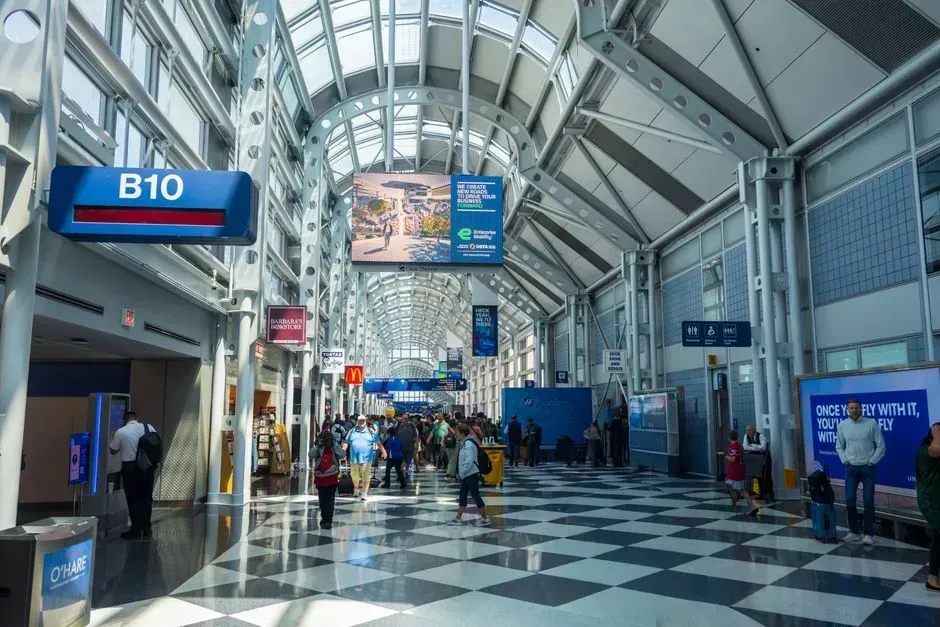
O’Hare’s sheer size works against it as often as it works in its favor. By 2025 Bureau of Transportation Statistics data, Chicago O’Hare sits around 64% on-time, dragged down by sheer volume, congested airspace and seasonal storms. That volume is staggering to begin with.
O’Hare has eight runways, more than any other airport in the U.S., which come in handy to handle the more than 80 million passengers who pass through each year. Even with that runway advantage, the density of traffic and Midwest weather swings make consistent on-time performance a persistent challenge.
Dallas Fort Worth International Airport
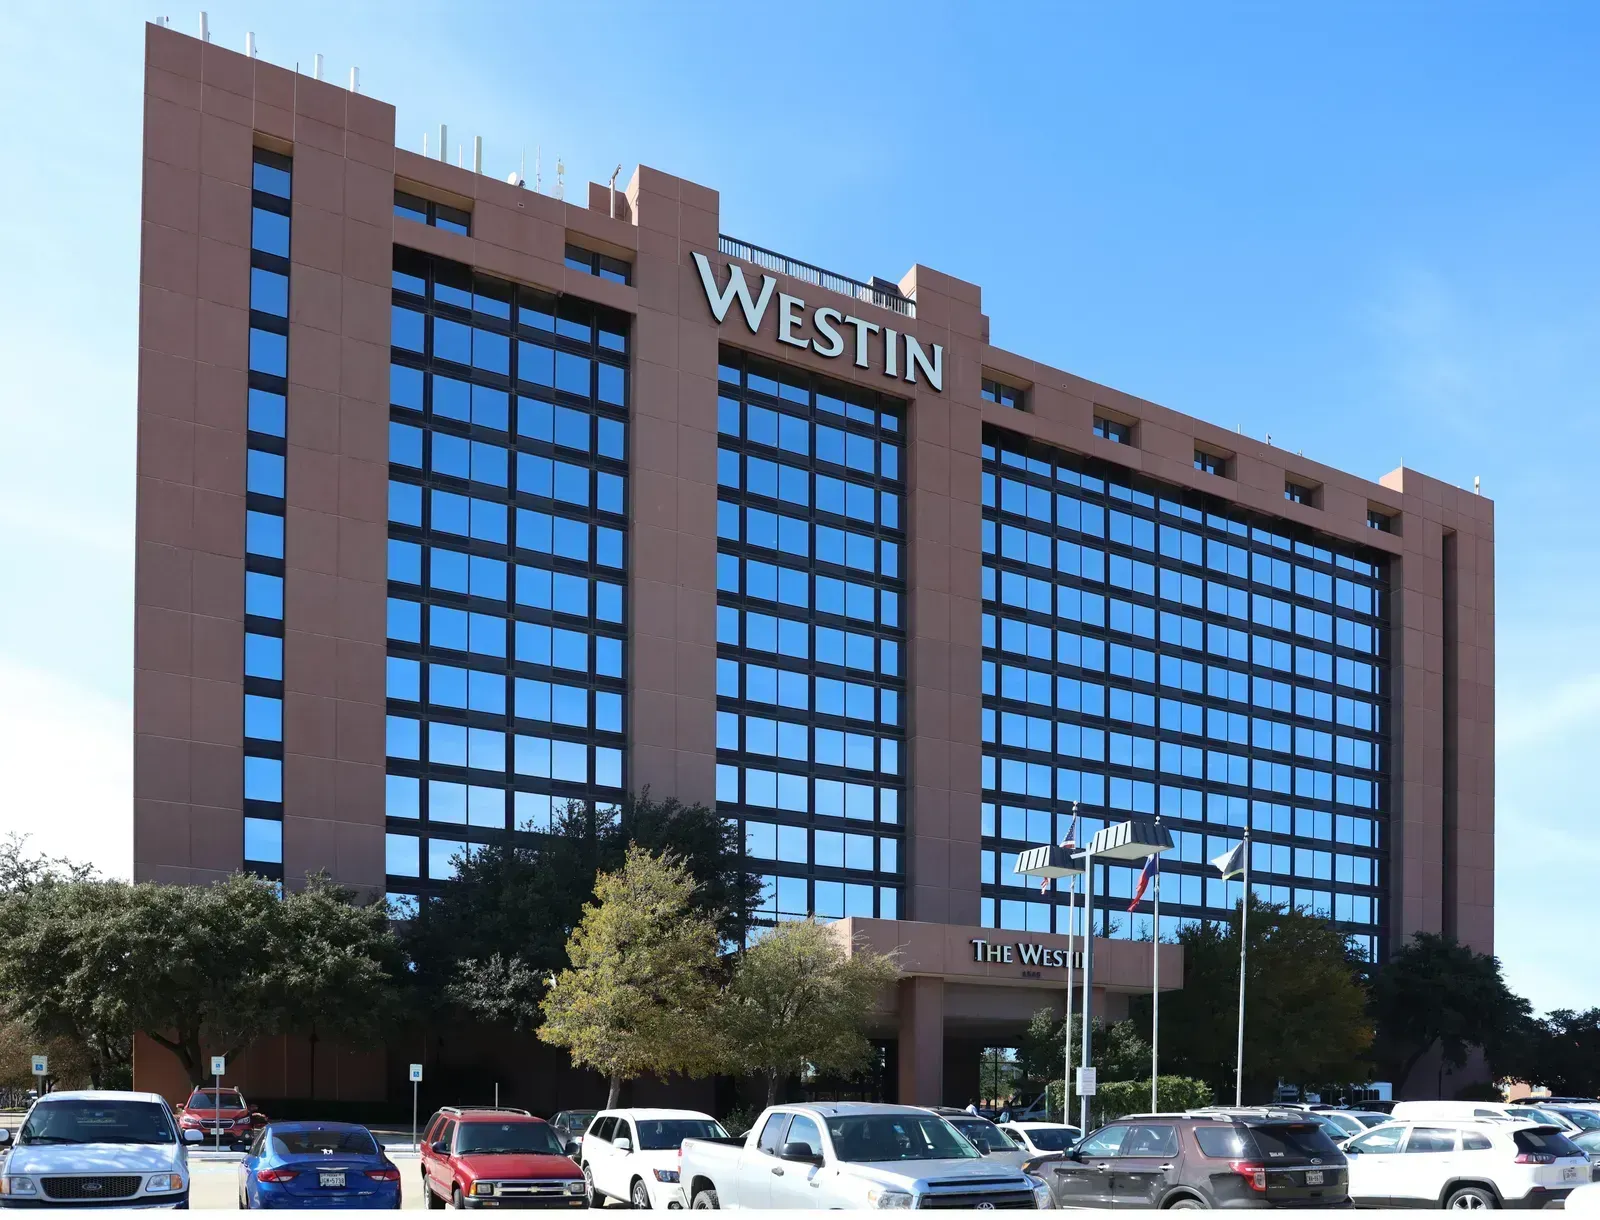
DFW’s problems tend to show up most sharply once a delay actually happens. If you’re stuck at Dallas/Fort Worth International waiting for your flight to depart, expect to wait about 73 minutes on average. Weather plays an outsized role at this Texas hub compared to most.
In 2025, 10% of the flight delays at Dallas/Fort Worth Airport were due to weather, more than any other airport in the top 10. As American Airlines’ largest hub and the country’s second-busiest airport, DFW simply has more moving pieces that can go wrong on any given day.
Boston Logan International Airport
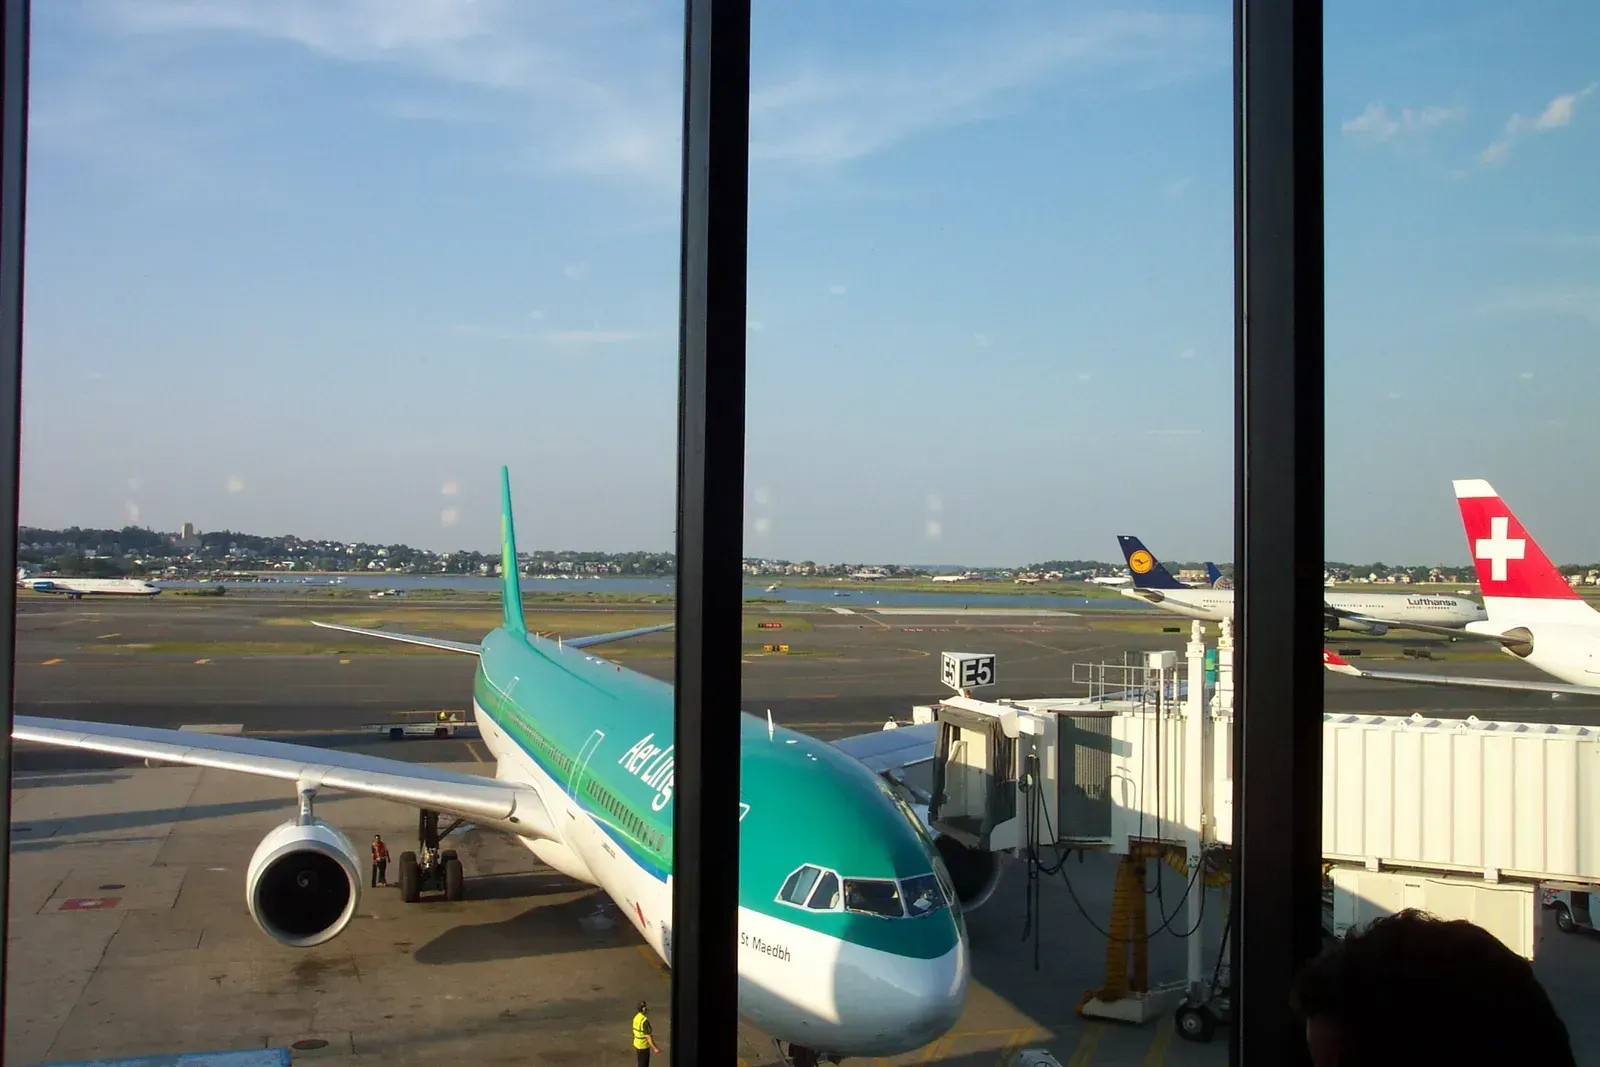
Boston doesn’t always come up first when people list problem airports, yet its numbers tell a clear story. Boston Logan International Airport posted an on-time performance of just 72.58% in 2025. That places it firmly among the busy hubs travelers now try to route around when they have a choice.
Coastal weather, a mix of regional and international traffic, and a compact airfield all contribute to the pattern. It’s the kind of airport where a clear forecast can still turn into a scramble once a storm rolls through somewhere else in the network.
Austin-Bergstrom International Airport
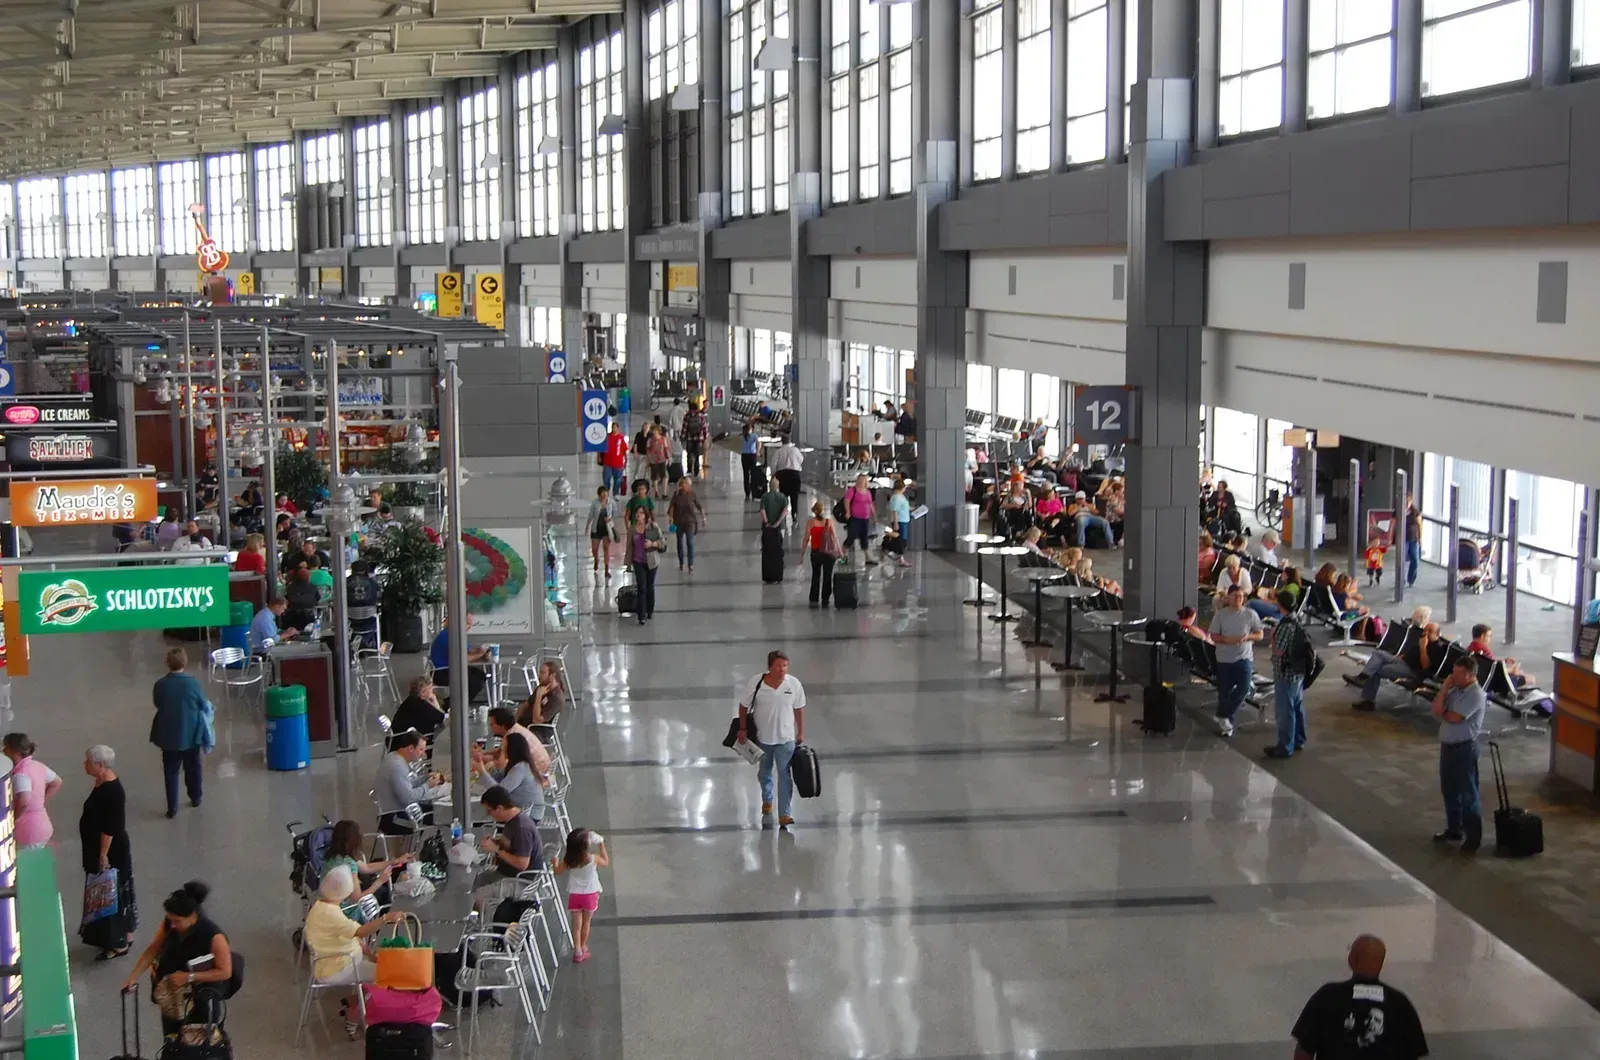
Austin’s rapid growth as a tech hub has brought a matching surge in flight volume, and the infrastructure hasn’t fully caught up. A study by AirAdvisor examining 47 U.S. airports for flights delayed by at least three hours measured what it calls LD180+ delays, arrival delays of 180 minutes or more. The results weren’t kind to the Texas capital.
Austin-Bergstrom International Airport emerged as the worst airport overall for significant delays, the study found. For travelers who’ve experienced a three-hour-plus wait firsthand, that finding lines up with what feels like an increasingly common story out of ABIA.
Fort Lauderdale-Hollywood International Airport
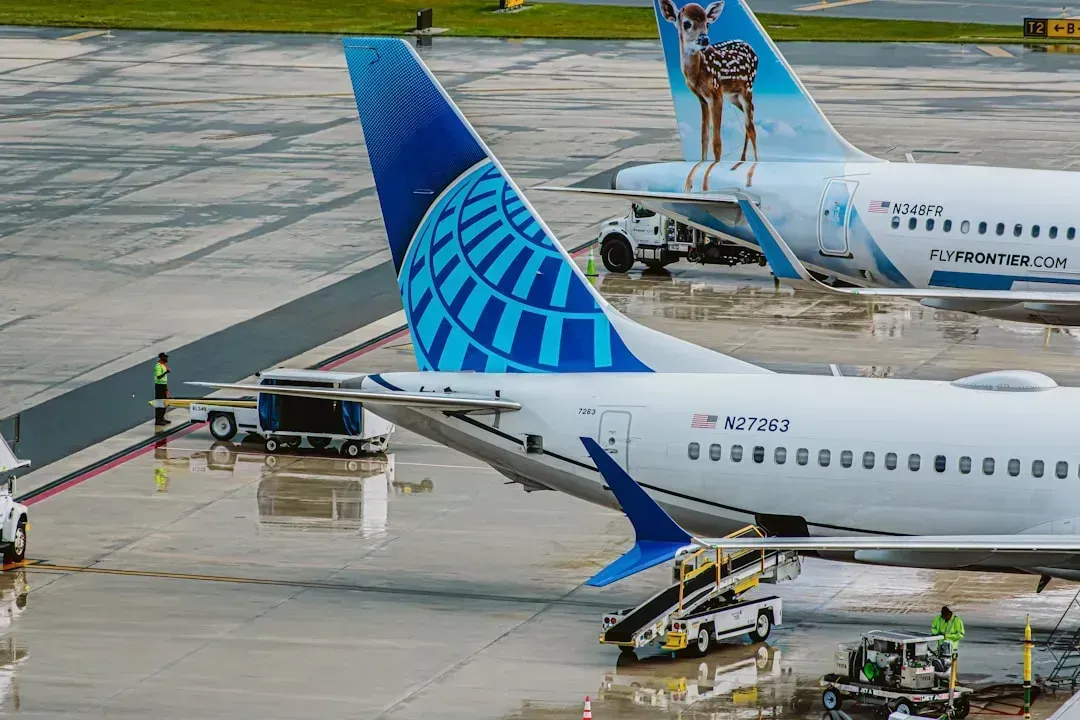
South Florida’s aviation gateways face a unique combination of weather and volume that other regions rarely see in the same intensity. The dubious honor of Florida’s most delayed airport goes to Fort Lauderdale-Hollywood International, where top causes included aircraft arriving late, air carrier delays, and disruptions tied to the National Aviation System, a broad set of circumstances covering air traffic control restrictions, heavy volume, and weather delays not confined to a single airport. It’s a layered problem rather than a single cause.
Orlando International and Fort Lauderdale Hollywood appear repeatedly in 2024 and 2025 rankings of airports with the most delays and cancellations, and both Florida gateways contend with intense thunderstorm seasons and periodic tropical systems. Summer travel through this corridor has become almost synonymous with schedule uncertainty.
Seattle-Tacoma International Airport
Sea-Tac’s numbers surprised a lot of people who assume Pacific Northwest weather is generally mild and predictable. Seattle-Tacoma Airport has a chronic delay rate of 59.04% and a long-delay rate for flights after 5 p.m. of 60.91%. That’s a notably high figure for an airport not usually grouped with the country’s most notorious delay hotspots.
Growth in traffic volume without matching gate and runway expansion appears to be part of the story here. Evening departures in particular seem to bear the brunt of cascading delays that build throughout the day.
What’s driving the pattern nationwide
Behind these individual airport stories sits a broader shift in the numbers themselves. Nationwide, 76.42% of all flights were on time in 2025, which the BTS defines as landing at its destination within 15 minutes of its scheduled arrival time. That’s a step down from the prior year’s showing.
Then came the November 2025 government shutdown, when unpaid controllers stopped showing up and the FAA ordered flight cuts at 40 major airports nationwide. Combine staffing shortages with aging infrastructure and steadily rising passenger volumes, and it’s easy to see why certain airports keep landing on these lists year after year rather than cycling through randomly.
The takeaway for travelers
None of this means these nine airports should be avoided entirely. Millions of people fly through them successfully every week, and plenty of flights land right on schedule. Still, the data offers a useful reality check for anyone booking a tight connection or a business trip where a three-hour delay would actually matter, and building in a little extra buffer time at these particular hubs is starting to look less like caution and more like common sense.





Leave a Reply